|
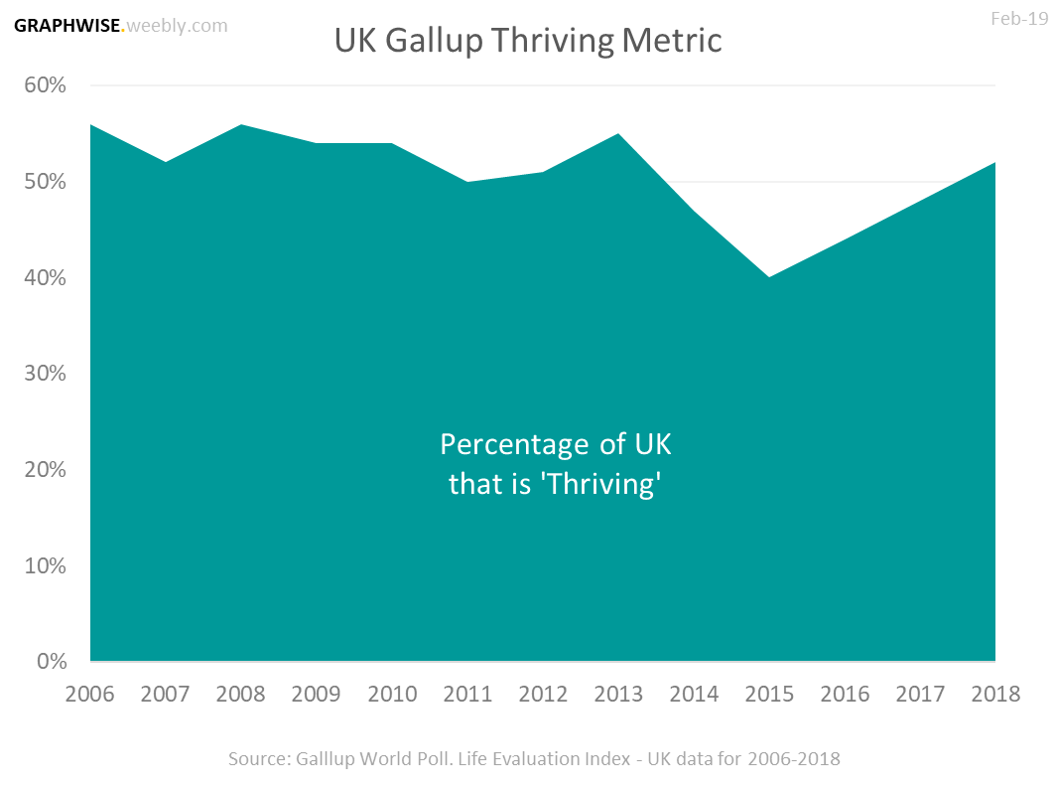
Q. How much of the UK is 'thriving'?
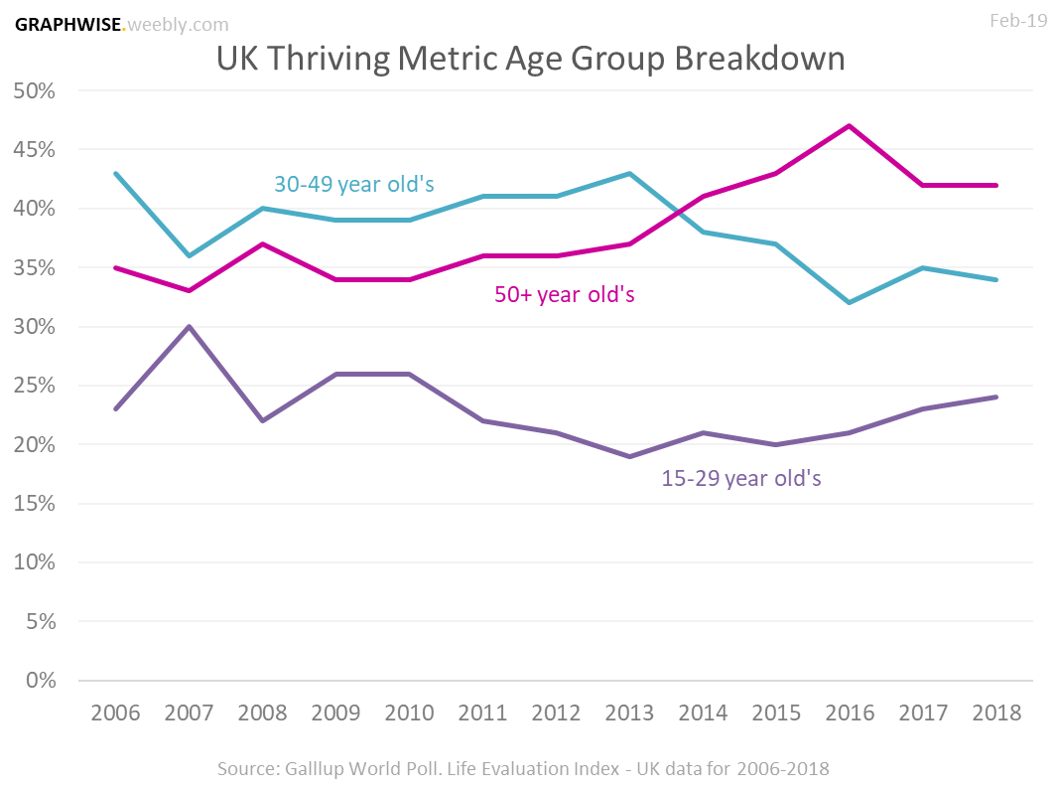
Q. What has been the trend? Q. How does it breakdown by age group? |
Sources
Gallup World Poll. Life Evaluation Index - UK data for 2006-2018 This data is not publicly available so no website link can be provided however, for further information around this insightful metric, please visit: https://news.gallup.com/opinion/gallup/206468/happiest-unhappiest-countries-world.aspx |
The Thriving Metric
|
This Thriving metric, which is generated by Gallup, measures a society's well-being through survey polls. It represents the percentage of people rating their current and future lives positively enough to be considered 'thriving'. Since 2006, the UK Thriving metric has been around 50%, then there was a drop to 40% between 2013 and 2015, before a steady increase back up to 50% in 2018. |
Age Breakdown
|
Over the last 10-12 years, the 15-29 year old age group has had a consistently lower 'Thriving' metric rating than the older generations. However, it has been gradually increasing since 2013. The 50+ year old age group increased between 2013 and 2016, before a slight drop in 2017 & 2018. Whereas, the 30-49 year old group were the most 'thriving' of the 3 until 2013, when there was a decrease until 2016 but has started to recover. |
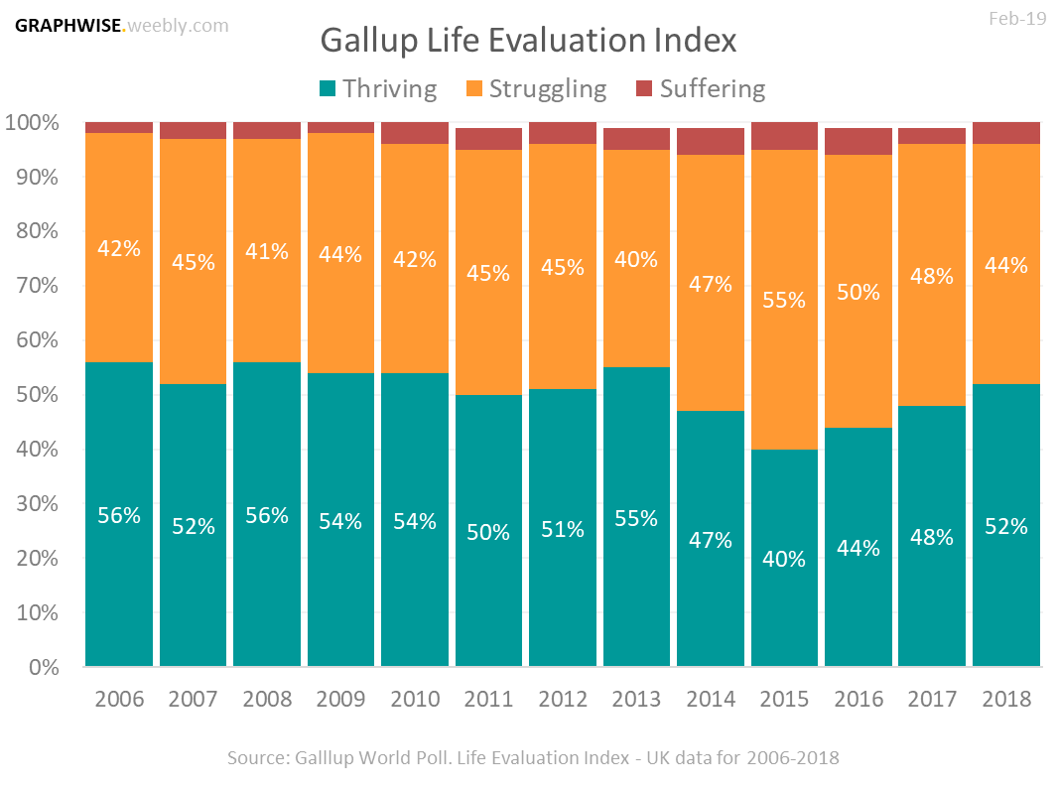
Further Breakdown - Thriving, Struggling and Suffering
|
This further breakdown shows that there is a minimal percentage of people in the UK who are considered by the Gallup poll as 'suffering', however many are still 'struggling'. 2015 had the lowest percentage of people 'thriving' in the UK, but this has since been improving. |