|
Q. How does the UK's carbon emissions compare with the other G7 countries?
Q. How does the UK's reductions compare? Q. Which countries have emitted the most carbon dioxide? Q. Which countries are currently emitting the most carbon dioxide? |
SOURCES
International Energy Agency. CO2 Emissions from Fuel Combustion 2018 Highlights. https://webstore.iea.org/co2-emissions-from-fuel-combustion-2018-highlight |
Comparing emissions per capita
|
|
From data sourced from the International Energy Agency, the US and Canada have significantly higher rates of CO2 emissions per person than the other G7 members and it has been this way since these records began (1971).
The UK has actually reduced the emissions per capita the most; 49.1% less in 2016 compared with 1971 levels. Other insights include Japan's emissions per capita have been increasing and Canada's has stayed approximately the same. |
Difference to baseline years
|
|
|
Comparing annual emissions
|
|
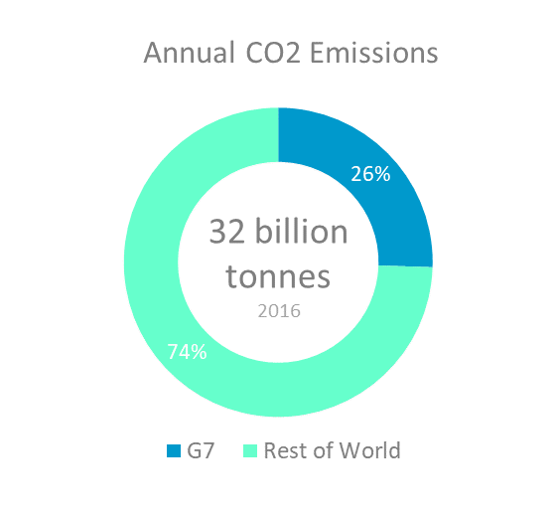
From the latest dataset in 2016, the annual CO2 emissions from G7 countries represents approximately 26% of the world total.
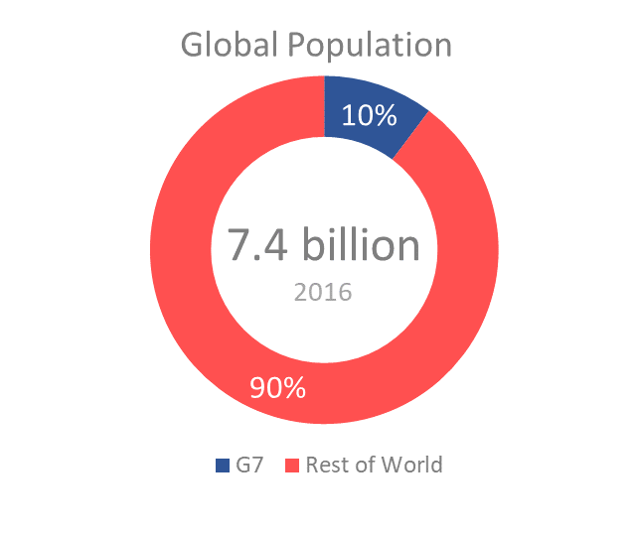
10% of the world population are effectively responsible for approximately 39% of the total carbon emitted since 1971. The US's CO2 emissions are significantly more than the other G7 countries but at least has shown a declining trend since 2000. By clicking on the United States to exclude it from the graph, it can be seen that Japan's emissions are however increasing. |
|
|
|
Difference to baseline years
|
|
|
Comparing accumulative emissions
|
|
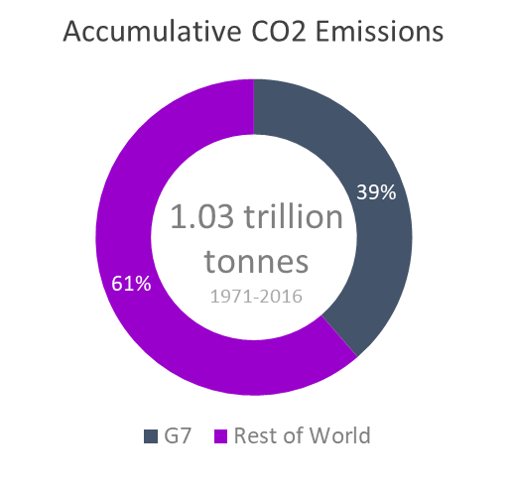
Accumulatively, the US has emitted the most CO2 emissions of all the G7 countries by far.
According to this dataset, the G7 have emitted 39% of the total CO2 emissions since 1971. |
Difference to baseline year
|
|
|
|
|
Comparing populations
|
|
|
|
|
Difference to baseline years
|
|
|