|
Q. How much is spent on...? Is the spending increasing or decreasing?
Q. Where is the government prioritising funding? Q. How does the Brexit spending compare with the EU payments? |
SOURCES
UK Government's PESA Reports (Public Expenditure Statistical Analyses) PESA 2010 Chapter 1 tables. MS Excel Spreadsheet, 326KB https://www.gov.uk/government/statistics/public-expenditure-statistical-analyses-2010 PESA 2013 Chapter 1: Departmental budgets tables. MS Excel Spreadsheet, 154KB https://www.gov.uk/government/statistics/public-expenditure-statistical-analyses-2013-update-for-2015-16 PESA 2017 Chapter 1 tables. MS Excel Spreadsheet, 164KB https://www.gov.uk/government/statistics/public-expenditure-statistical-analyses-2017 |
Government Spending Breakdown
|
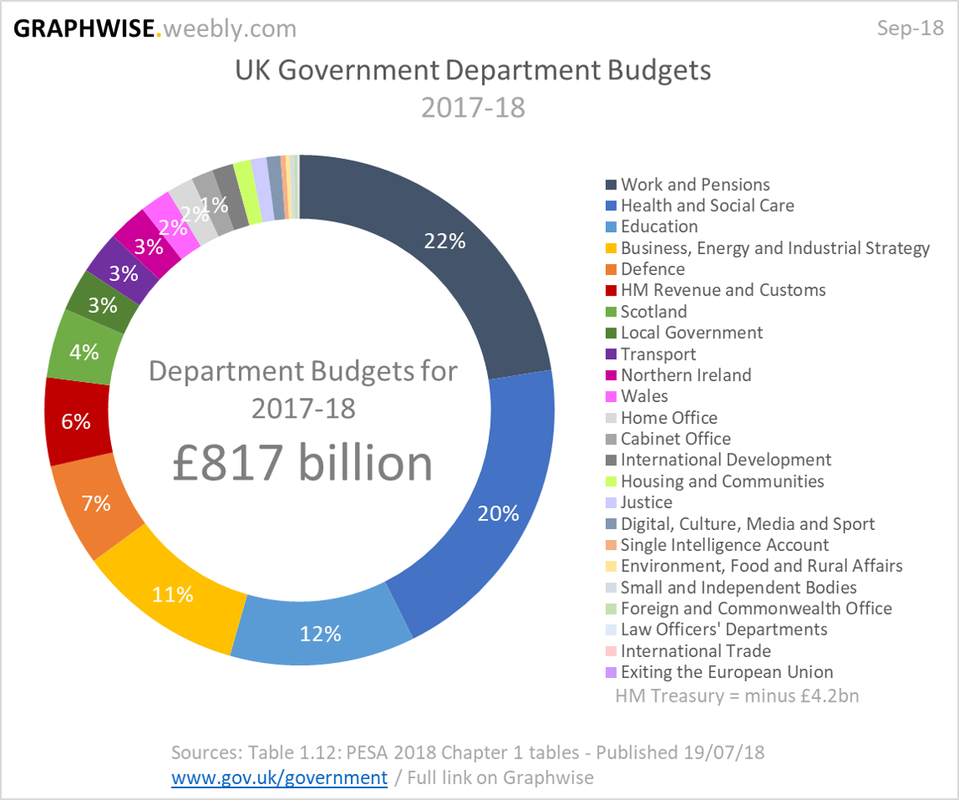
In the financial year 2017-18, the total departmental Budget was £817 billion, with the most going to 'Work & Pensions', 'Health & Social Care', and Education; taking a combined 54% of the overall amount. The next highest spends were in 'Business, Energy & Industrial Strategy', Defence, and HMRC. The remaining 25% of the budget went to local governments and other smaller departments. |
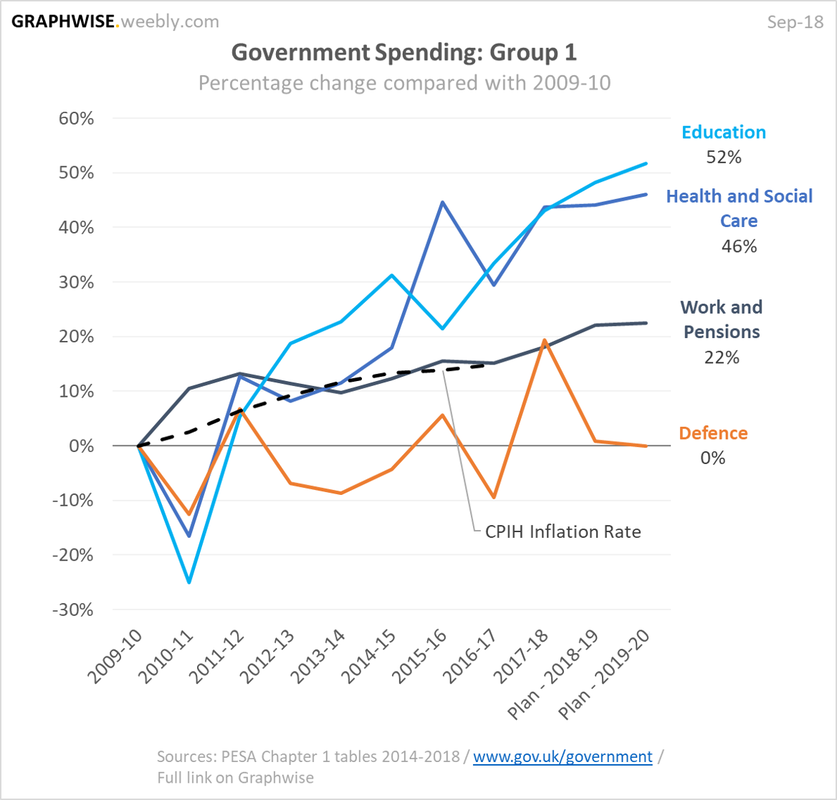
Since 2009-10, Education and 'Health & Social Care' spending has increased with a net 45-50% increase in 2017=18, whereas Defence has stayed around the same amount. 'Work & Pensions' has roughly increased at the same rate as inflation. |
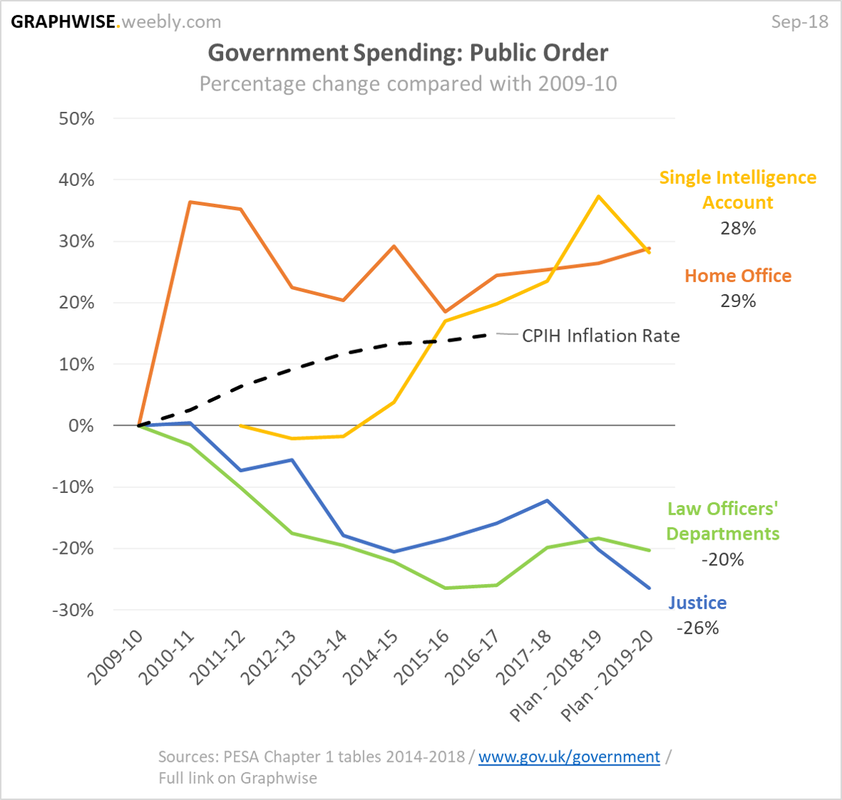
In terms of 'Public Order' spending, the Home Office and Single Intelligence Account have both had spending increases, whereas Law Officers' Departments and Justice have both seen a decrease in spending. |
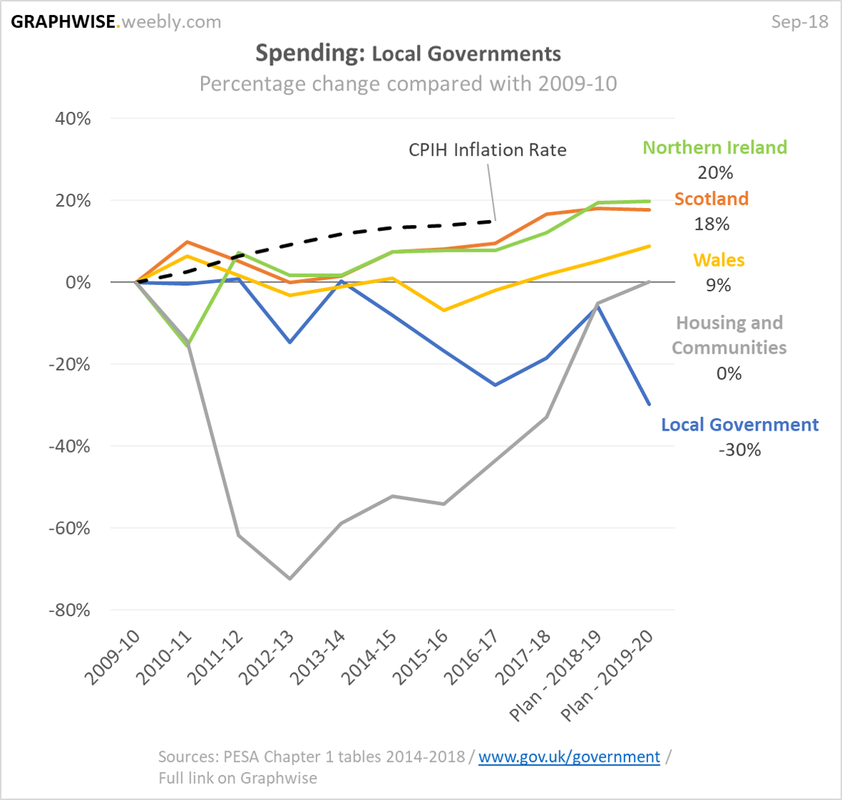
The 'Housing & Communities' spending dropped significantly between 2009-10 and 2012-13 but has since increased back to 2009-10 levels again. Spending changes for Northern Ireland, Scotland and Wales have all been roughly the same, with minimal increases overall and mostly below the inflation rate. |
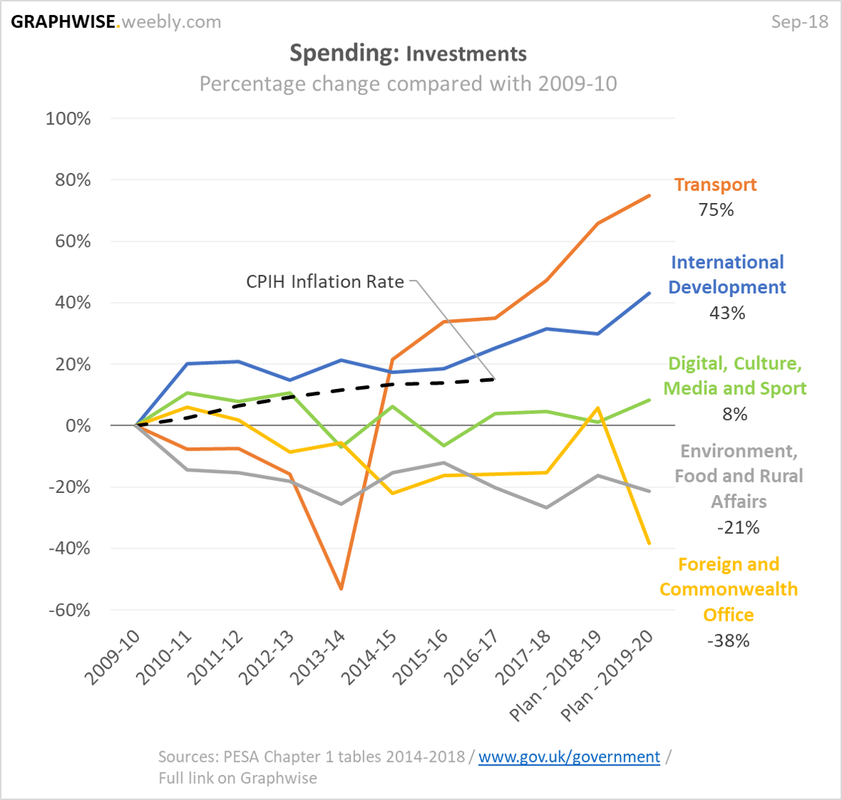
Comparing 2017-18 with 2009-10, Transport spending has overall increased by around 60%, after initially decreasing up to 2013-14. 'International Development' spending has been steadily increasing, whereas 'Environment, Food & Rural Affairs' and the 'Foreign & Commonwealth Office' have both seen a decreasing trend in spending. |
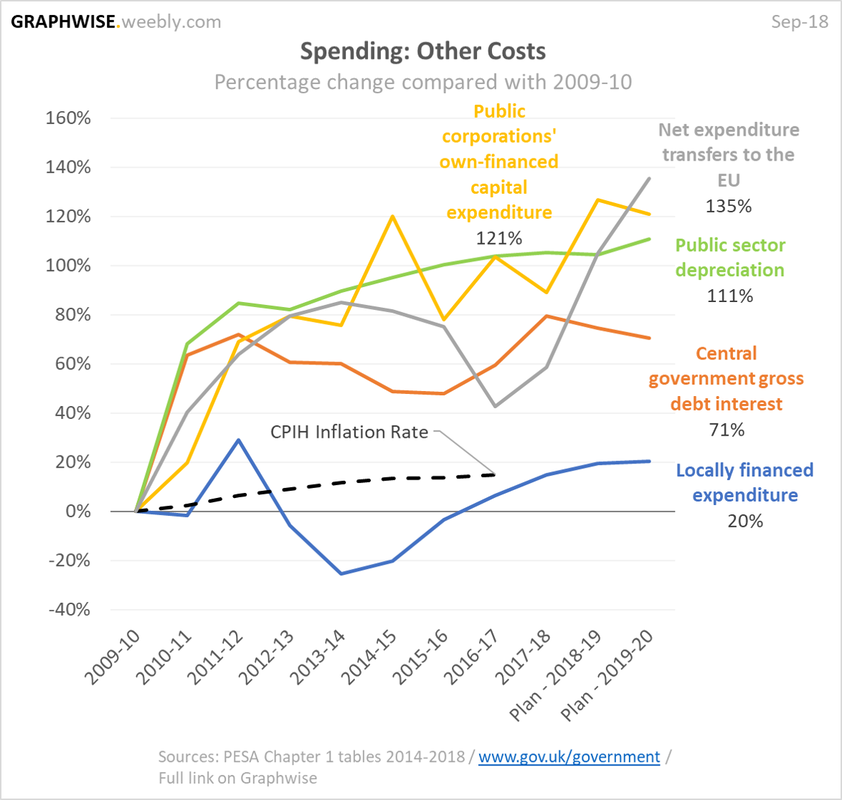
Although these Department Spends are relatively low in comparison to the main ones, there have been some significant changes since the 2009-10 baseline, with 'Public corporations' own-financed capital expenditure', 'Net expenditure transfer to the EU' and 'Public sector depreciation' all more than doubling in value. |
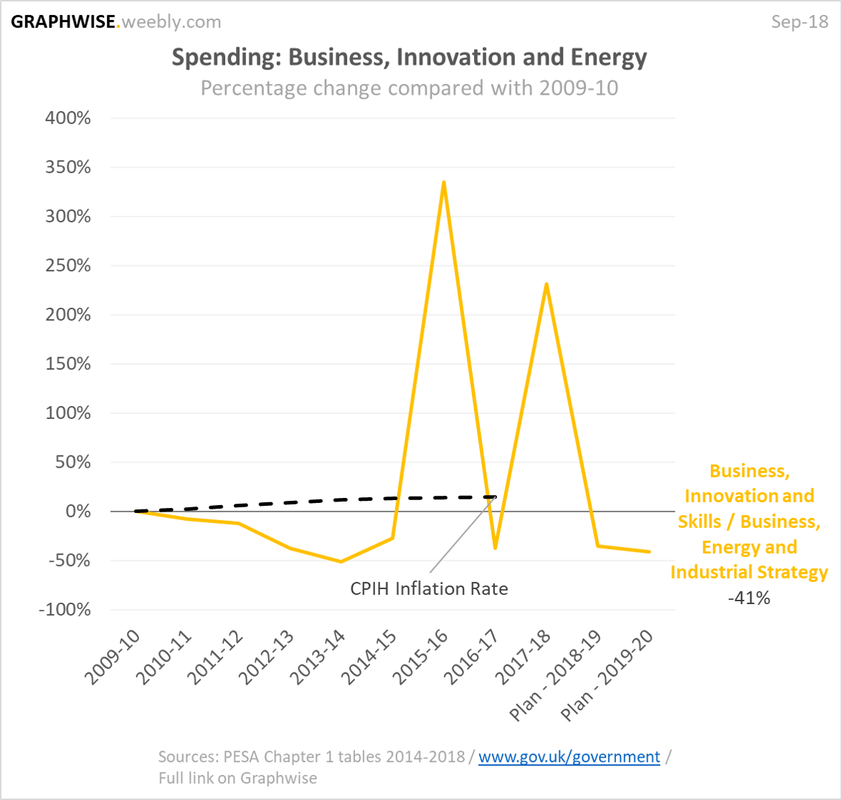
'Business' has seen significant one-off investments in 2015-16 and 2017-18, however otherwise there is a decreasing trend with 2018-19 & 2019-20 planned to drop to 40% less than 2009-10. 'Business, Energy & Industrial Strategy' was created on 14 July 2016, merging the 'Department of Energy & Climate Change' with the 'Department for Business, Innovation and Skills'. |