|
Q. What is the UK national debt? How has it changed?
Q. What is the breakdown? Who is the money owed to? Q. How much interest is added each year? |
Sources
UK Debt Management Office. Distribution of gilt holdings 2018 Q4. https://www.dmo.gov.uk/data/gilt-market/ ONS. Government deficit and debt return. Released 17 Jan 2019 https://www.ons.gov.uk/economy/governmentpublicsectorandtaxes/publicsectorfinance/datasets/governmentdeficitanddebtreturn HM Treasury. Public Expenditure Statistical Analyses 2008, 2013 and 2018. Latest published 19 July 2018. https://www.gov.uk/government/statistics/public-expenditure-statistical-analyses-2018 For Gilt Holdings by country: Not publicly available but kindly provided by the ‘UK Debt Management Office’ via a Freedom of Information request, as linked below. www.whatdotheyknow.com/request/overseas_holdings_breakdown_by_c |
National Debt
|
|
UK National Debt (GBP)
1997
2007
2017
Between 1992 and 2007, the UK's National Debt increased from around £250 billion to £650 billion. Then, between 2008 and 2017, it went from £785 billion to £1.78 trillion. The trend shows the rate of increase is slowing down but the overall amount is still going up. Gross Domestic Product (GBP) is a measure of a country's income so this comparison shows the UK is getting closer to owing as much as they are making as a nation each year (87% in 2017). |
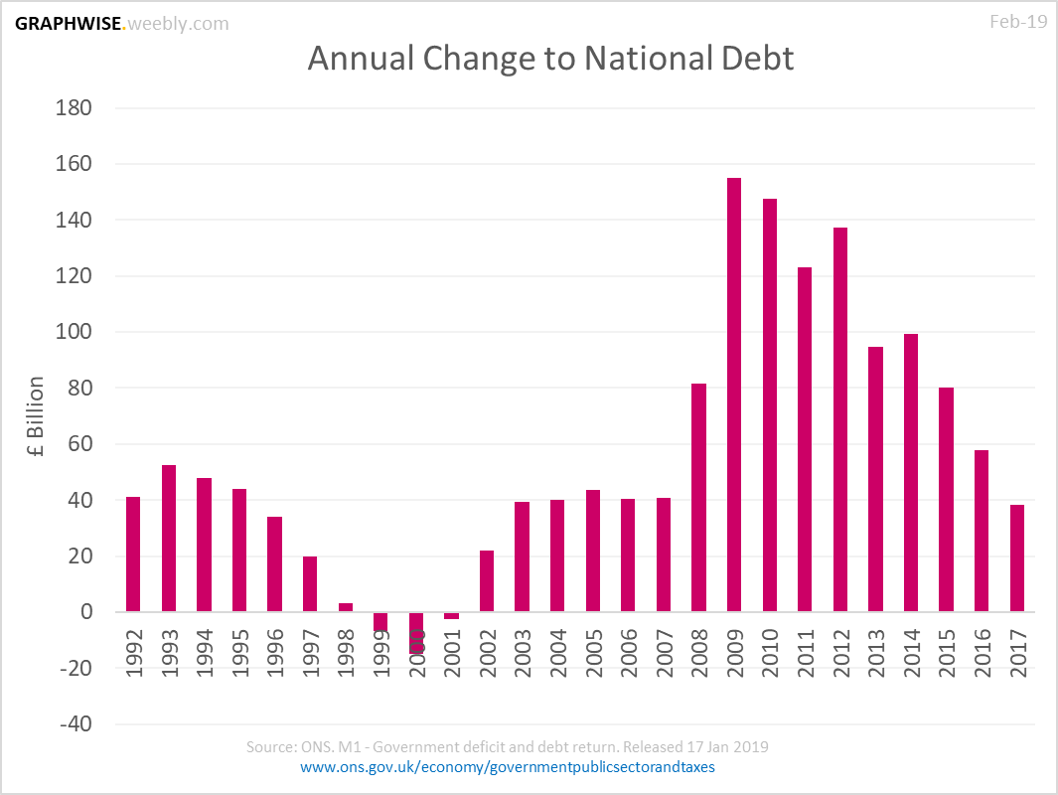
There was a few years between 1999 and 2001 where the National Debt was actually being paid off. Between 1992 and 2007, the maximum being added was around £40-50 billion, whereas between 2009 and 2012, £120-155 billion was being added to the National Debt every year. |
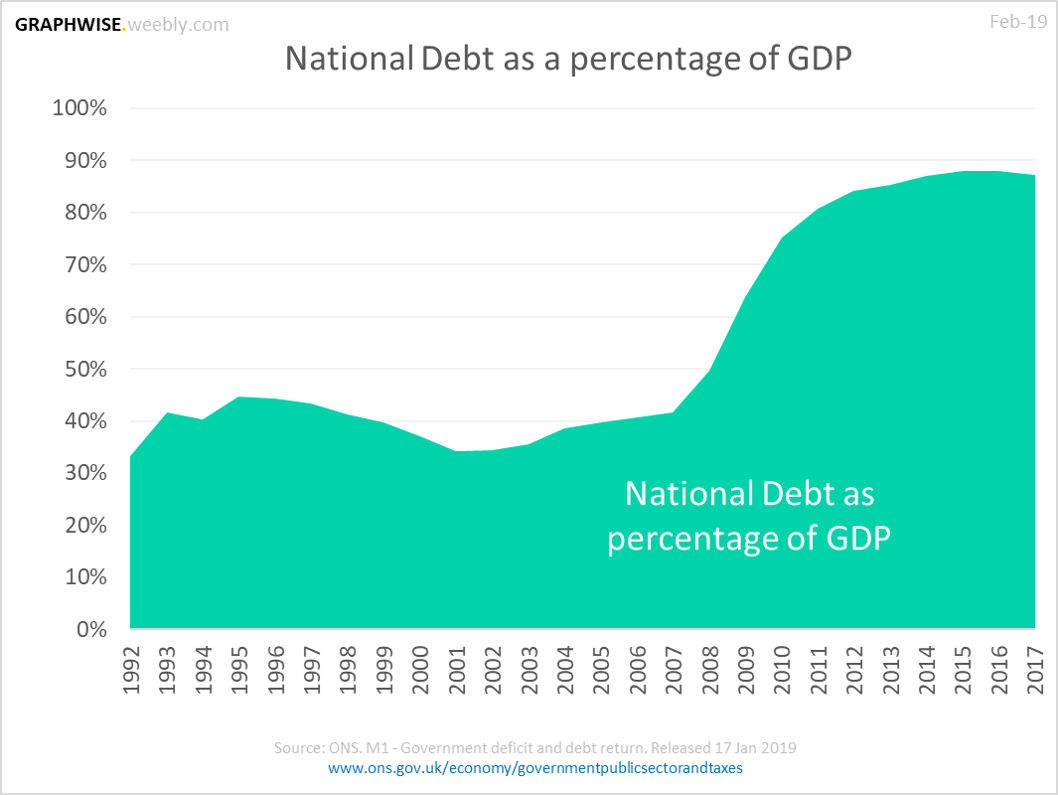
As a percentage of GDP, pre-2008 the UK National Debt was at around 40%, but since 2011 this has increased to above 80%. This is an indicator of how difficult it will be to pay of the debt. |
Interest
|
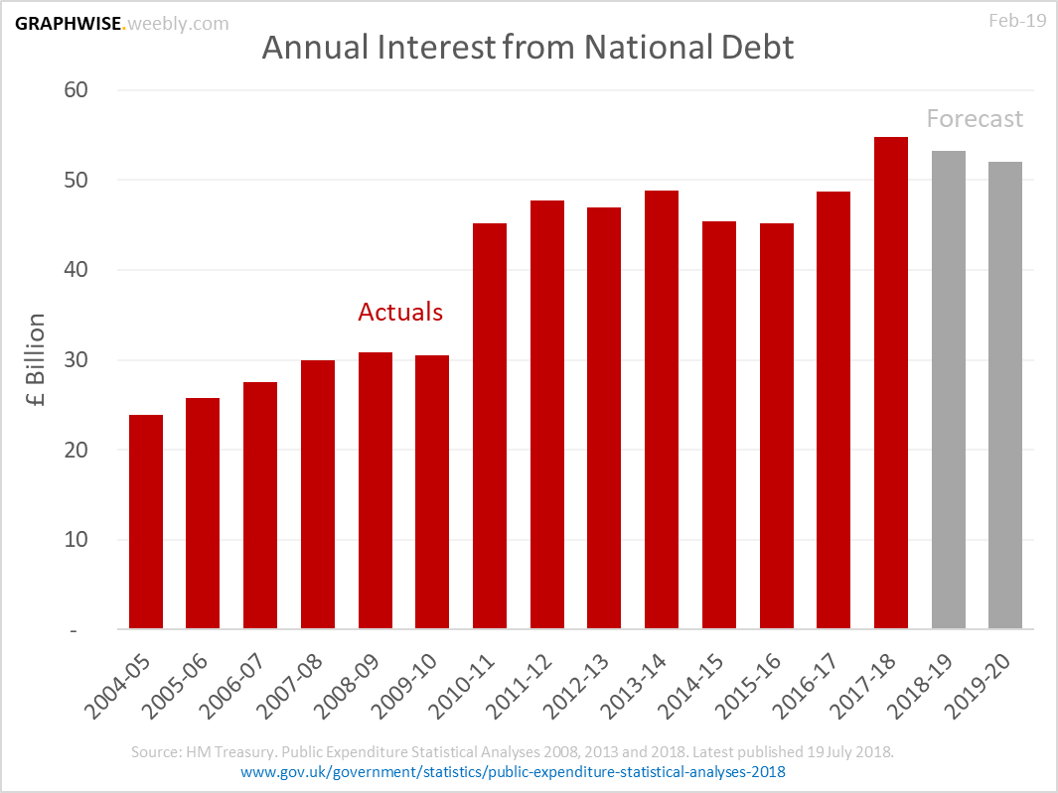
Every year, interest is being added to the National Debt, with a trend towards higher and higher numbers. Whilst in 2004-05 the interest added to the National Debt was around £24 billion, in 2017-18 this has increased significantly to approximately £55 billion. |
Who Owns the Debt?
|
|
|
|
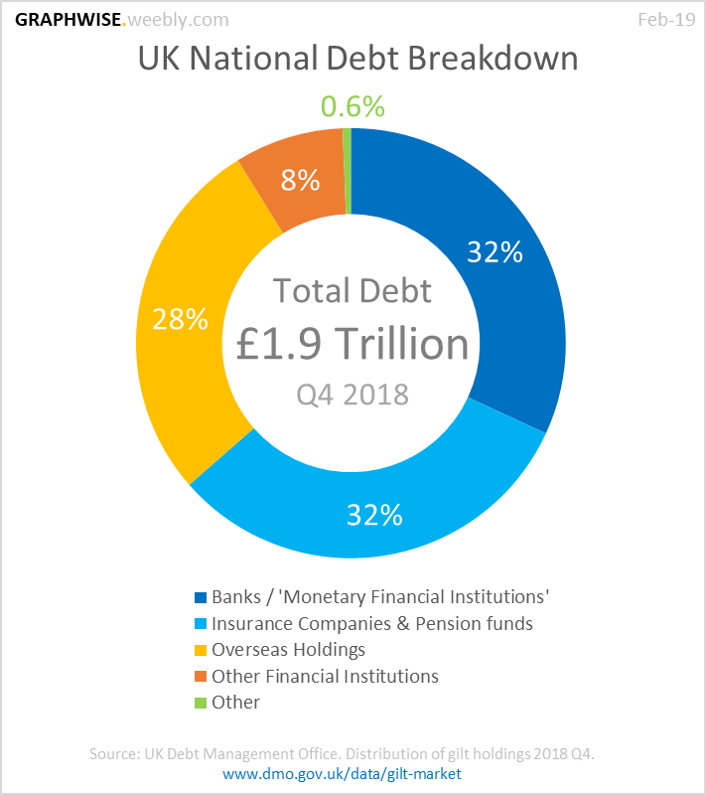
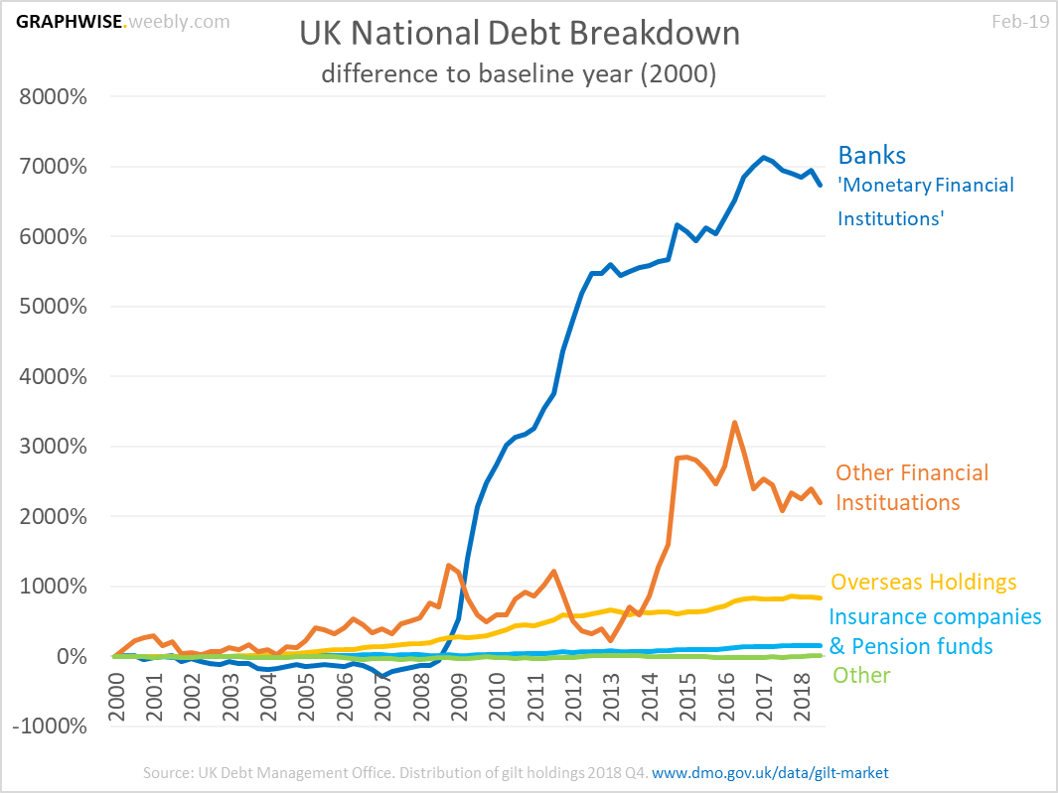
32% of the debt is owed to Banks, another 32% to Insurance companies & pension funds, and 28% to 'Overseas Holdings'. The most significant change in who the UK owes money to, has been the Banks. Since 2000, the money owed to the Banks has increased by 7,000%, with a decrease up to 2008 and then a sharp increase from there onwards. |
|
|
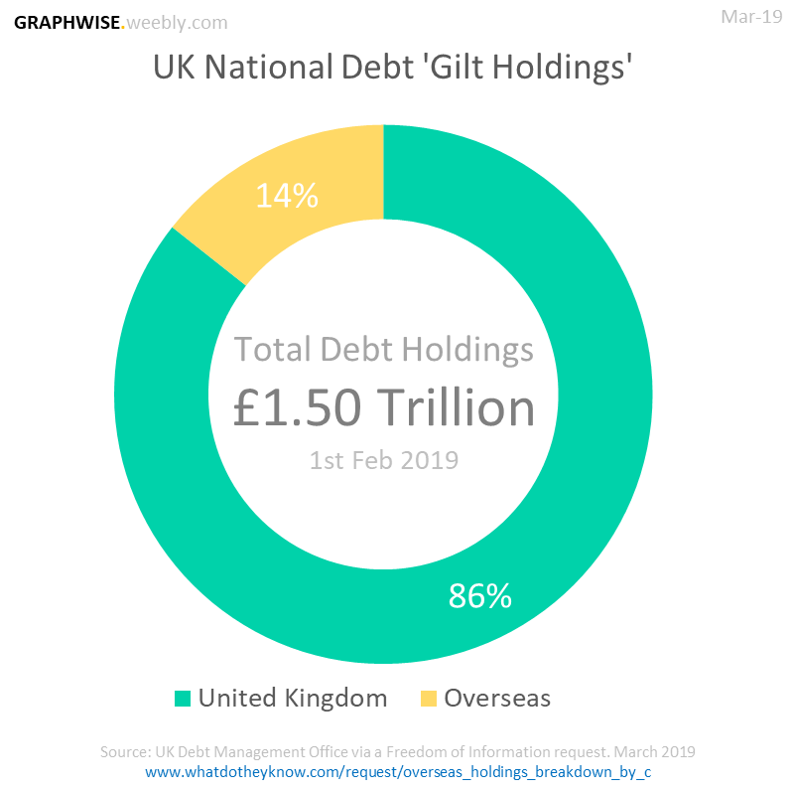
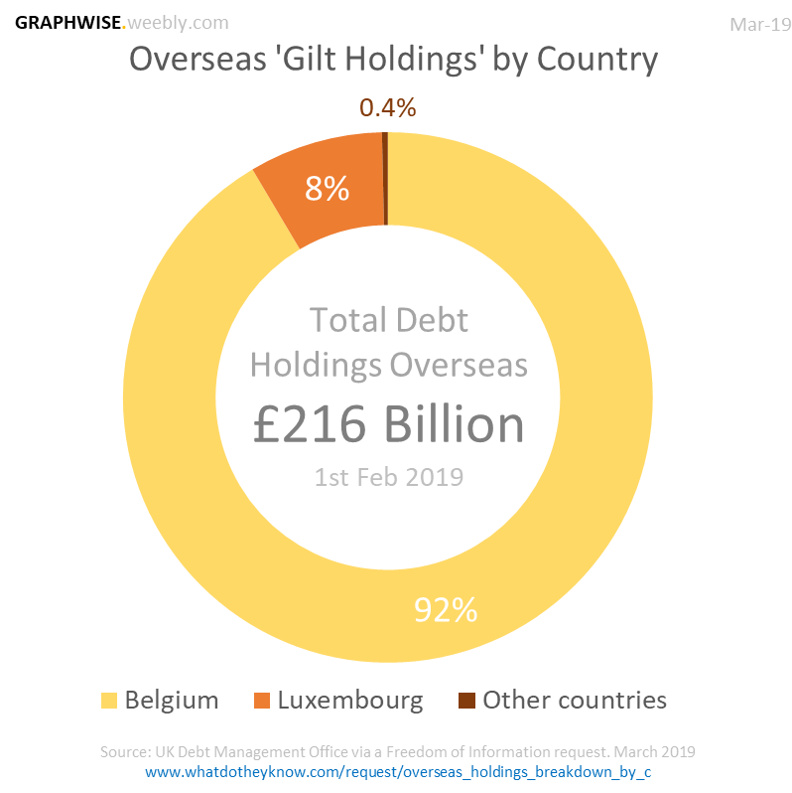
At 1st Feb 2019, the percentage of debt 'gilt holdings' that is held overseas was 14%; or £216 billion. Of this £216 billion, 92% is with Belgium holders, 8% with Luxembourg holders, and the remaining 0.4% is with holders registered in other countries (50 total). |