|
Q. How many houses are there in the UK?
Q. How many houses are being built each year? Q. How does the rate of house building compare with the historical trend? Q. What is the trend of privately built houses versus government built houses? |
Sources
England Table 120: components of housing supply; net additional dwellings, England 2006-07 to 2016-17 Table 100: number of dwellings by tenure and district, England https://www.gov.uk/government/statistical-data-sets/live-tables-on-net-supply-of-housing https://www.gov.uk/government/statistical-data-sets/live-tables-on-dwelling-stock-including-vacants Scotland Housing Statistics for Scotland - Key Information and Summary Tables http://www.gov.scot/Topics/Statistics/Browse/Housing-Regeneration/HSfS/KeyInfoTables Wales Dwelling stock estimates by year and tenure https://statswales.gov.wales/Catalogue/Housing/Dwelling-Stock-Estimates Northern Ireland Housing stock tables 2008-2017 https://www.finance-ni.gov.uk/publications/annual-housing-stock-statistic Latest government 'dwelling' / housing estimated figures taken on 18/12/17. Data available for England, Scotland and Northern Ireland 2009/10-2016/17. Data available for Wales 2009/10-2015/16. 2016/17 figures due April 2018. |
Number of Houses
|
|
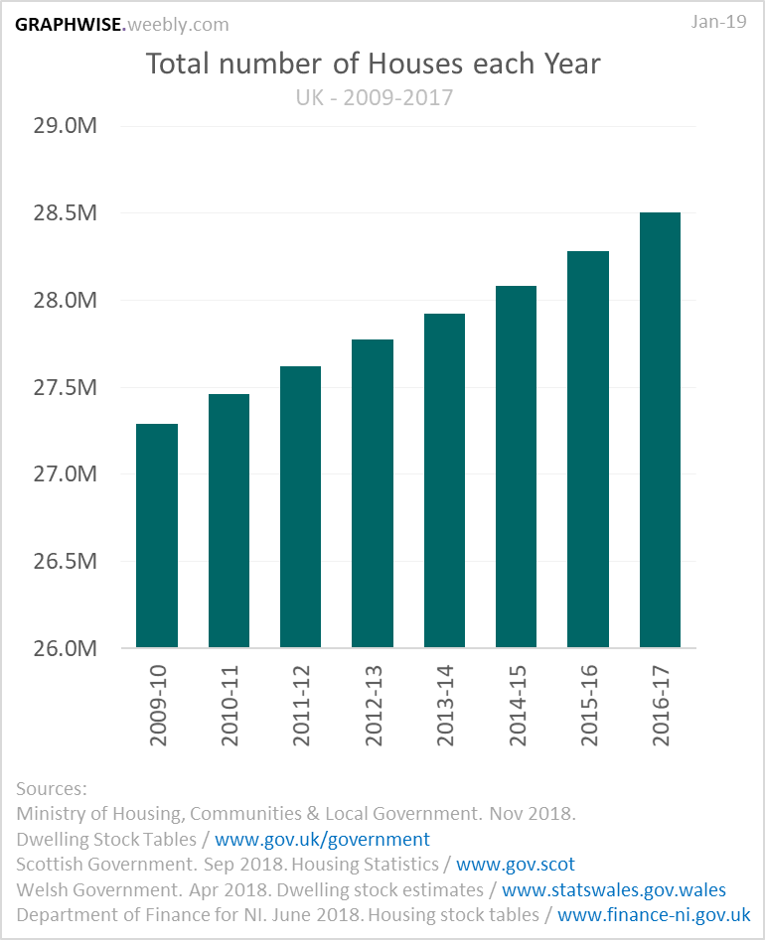
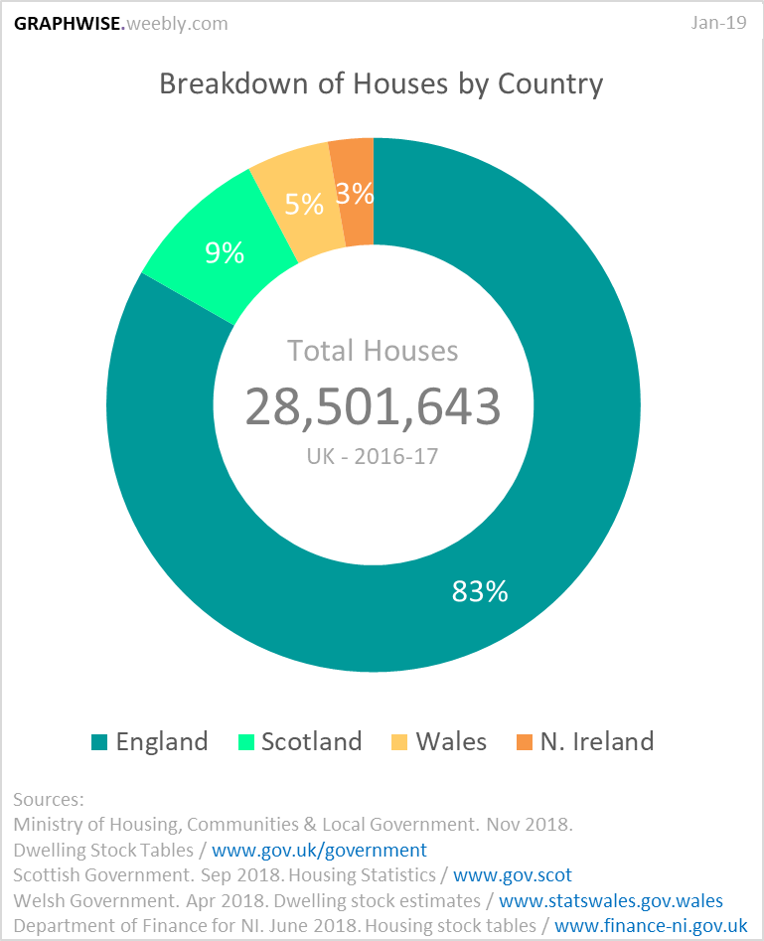
Since 2009, the number of houses in the UK has steadily increased each year to around 28.5 million. Houses in England makes up 83% of the total, Scotland 9%, Wales 5%, and Northern Ireland 3%. |
|
|
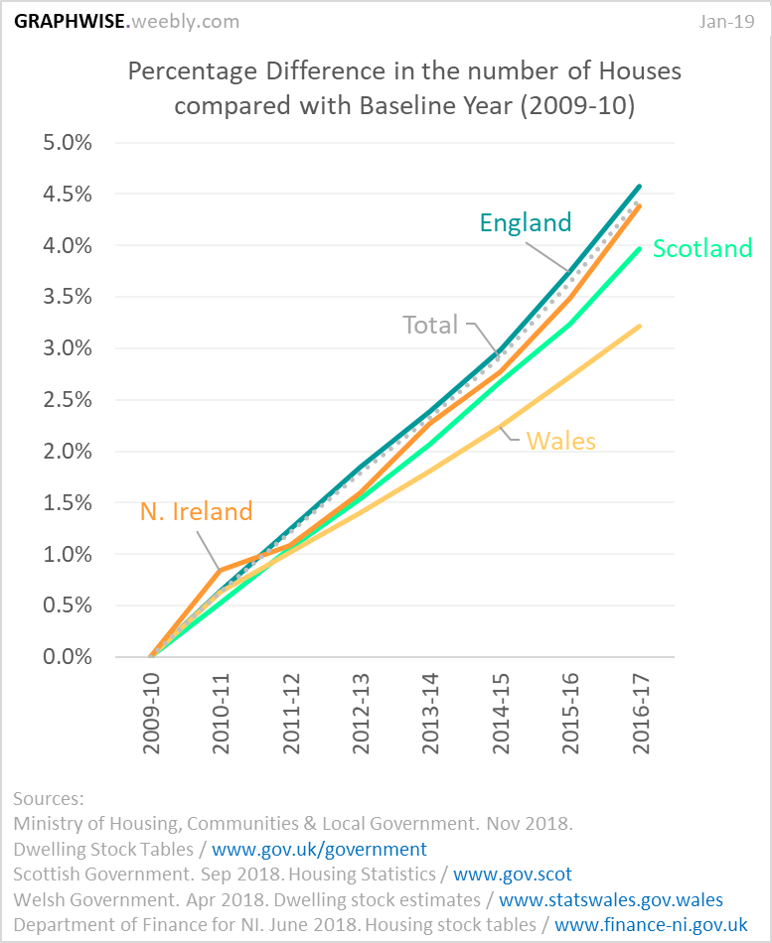
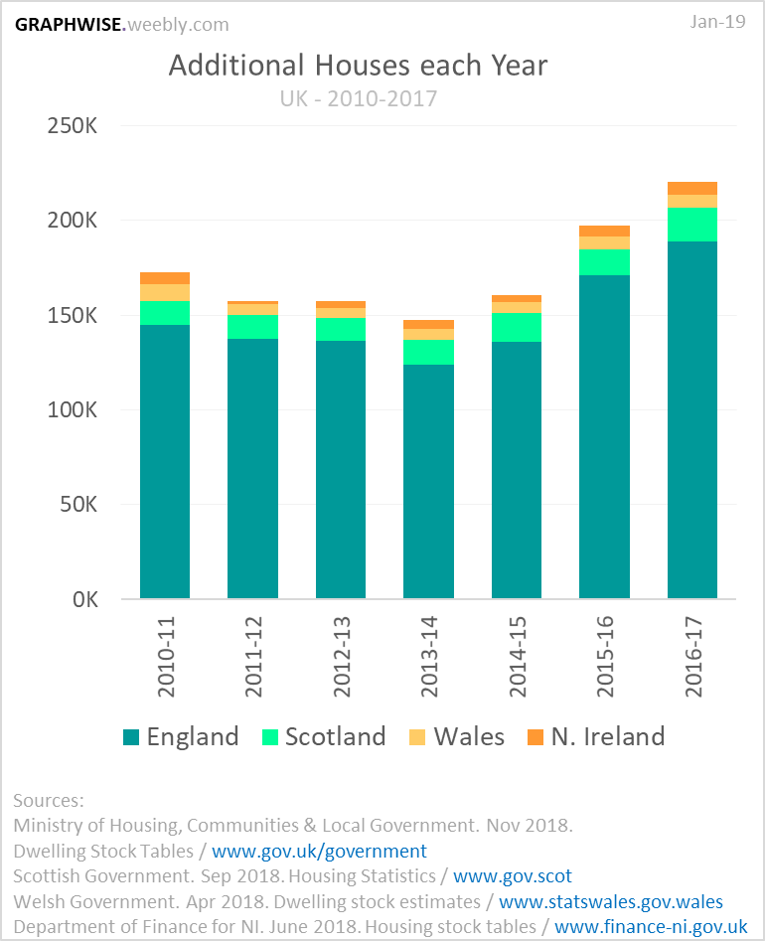
Since 2009, the rate of house building has been roughly the same for each UK country, with England slightly more than the others. From 2010, the amount of houses being built decreased slightly until 2013, when the annual amount has increased. Approximately 220 thousand more houses were built in the UK during the financial year 2016-17. |
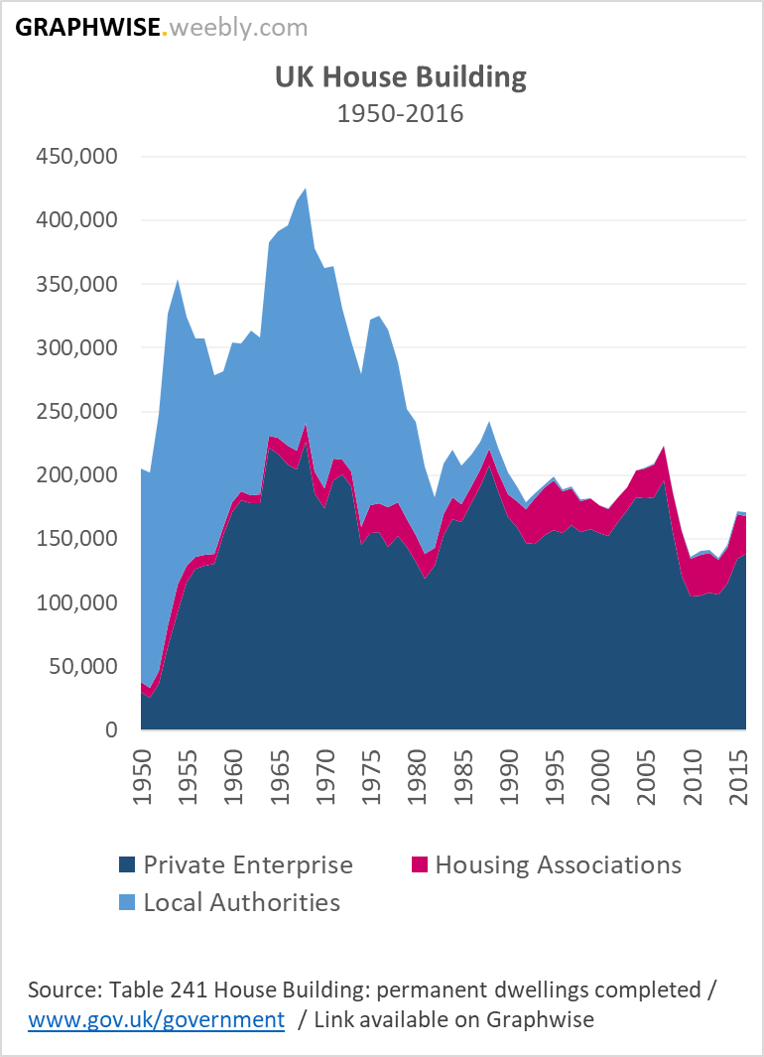
House Building since the 1950's
|
Looking further back to the 1950s, 60s & 70s, the rate of house building was significantly more than today; approximately 50-70% more. This difference is due to the significant amount of houses being built by Local Authorities throughout the 50s, 60s, and 70s, which decreased in the 80s to practically zero in the 90s and onwards. |
