|
Q. How does the UK compare with the rest of the G20 countries?
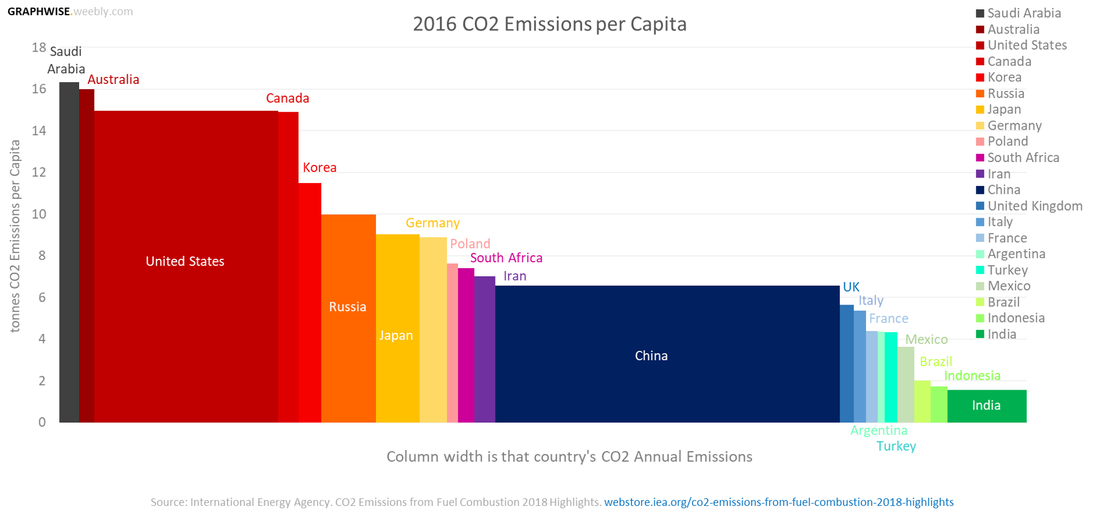
Q. Which countries are emitting the most CO2 per capita? Q. Which countries are emitting the most CO2 each year? Q. Where does the UK sit in this context? |
Sources
International Energy Agency. CO2 Emissions from Fuel Combustion 2018 Highlights. webstore.iea.org/co2-emissions-from-fuel-combustion-2018-highlights |
G20+ Countries' CO2 Emissions per Capita
Note: 'The EU' is part of the G20 but has not been included in this analysis.
How to use the graphs below
De-select and select countries by clicking on them in the legend.
Hover over the lines or country names to highlight them in the graph.
You can also click and drag to zoom in. Click 'Reset Zoom' to cancel. However, unfortunately this doesn't work on touchscreens.
Be careful not to click the 'Powered by Highcharts Cloud' at the bottom of each graph, as this link will send you to the Highcharts website.
|
|
|