|
Q. How many A&E attendances are there a year? How has this changed?
Q. In England, is the NHS achieving the A&E waiting time target? How has this changed? Q. What is driving the waiting time performance? |
SOURCES
NHS England. A&E Attendances and Emergency Admissions 2017-18. Quarterly time series. www.england.nhs.uk/statistics/statistical-work-areas/ae-waiting-times-and-activity/ae-attendances-and-emergency-admissions-2017-18/ NHS Digital. Hospital Accident and Emergency Activity, 2017-18. Publication date: 13 Sep 2018 - Summary Report Tables https://digital.nhs.uk/data-and-information/publications/statistical/hospital-accident--emergency-activity/2017-18 ONS. Mid-2017 Population Estimates for UK, England and Wales, Scotland and Northern Ireland. Release date: 28 June 2018. Next release: June 2019 www.ons.gov.uk/peoplepopulationandcommunity/populationandmigration/populationestimates/datasets/populationestimatesforukenglandandwalesscotlandandnorthernireland |
Number of Attendances
|
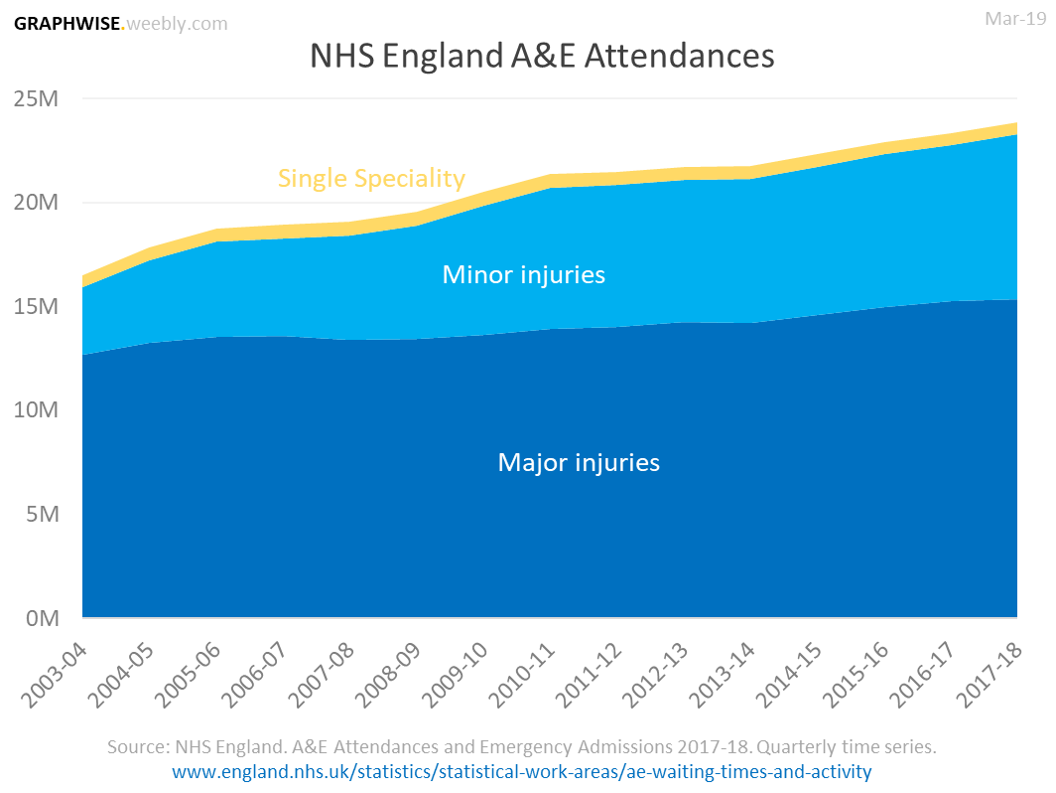
The number of Accident & Emergency (A&E) attendances in England has been increasing at a steady rate, from 15 million in 2003-04 to 24 million in 2017-18.
There are 3 categories; Major injuries, Minor injuries, and Single Speciality. Major injuries make us the vast majority of the attendances (64%), Minor injuries make up about a third (33%), with Single Speciality attendees making up the remaining 3%. |
|
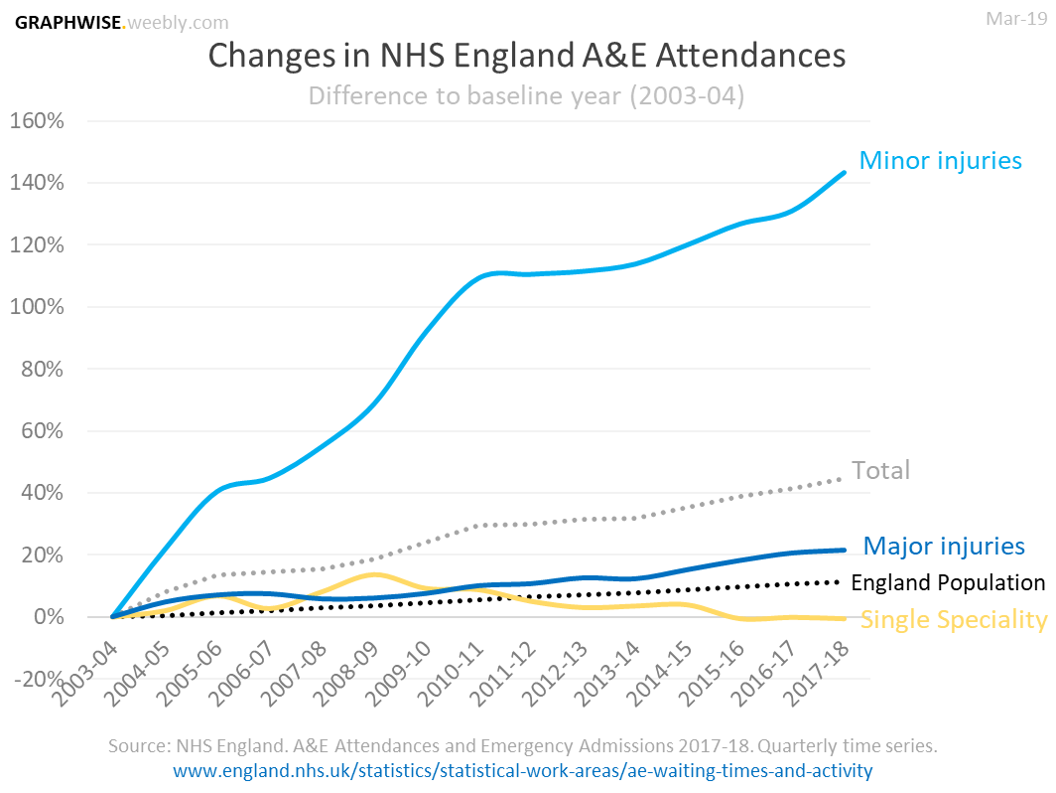
As a percentage difference to the baseline year (2003-04), there has been a significant increase in the number of people attending A&E for minor injuries; 143% more in 2017-18 - so more than doubled in 14 years.
Total numbers of attendances have increased by 45%, which is significantly above the population increase of 11%. This increasing demand on A&E will be a key contributor to the performance. |
Waiting Times
|
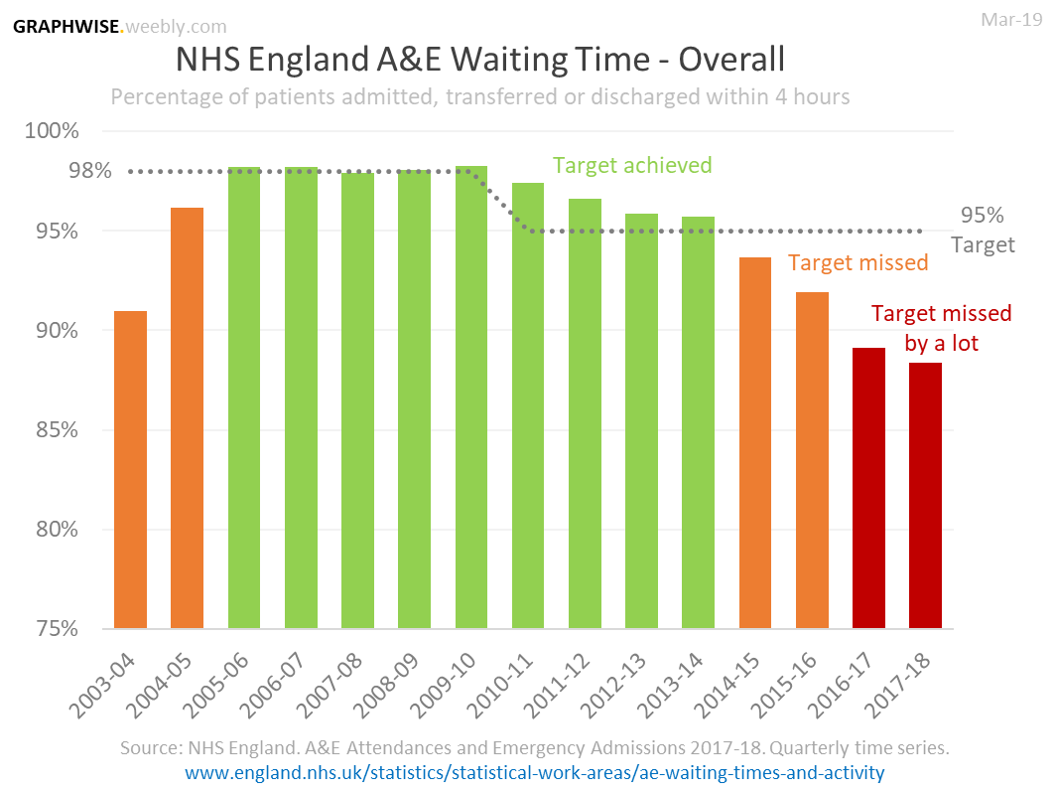
The government have set A&E performance targets including one based on the percentage of patients being 'admitted, transferred or discharged within 4 hours'.
Initially this was set at 98% but was dropped to 95% in 2010-11. The data shows performance was below the 98% target in 2003-04 but improvements were made and in 2 years this target was achieved. This level of service was maintained for 5 years but then since 2010-11, there has been a consistent decline, with the revised 95% target missed in 2014-15 and in all years since then, with no signs of this trend being reversed. |
|
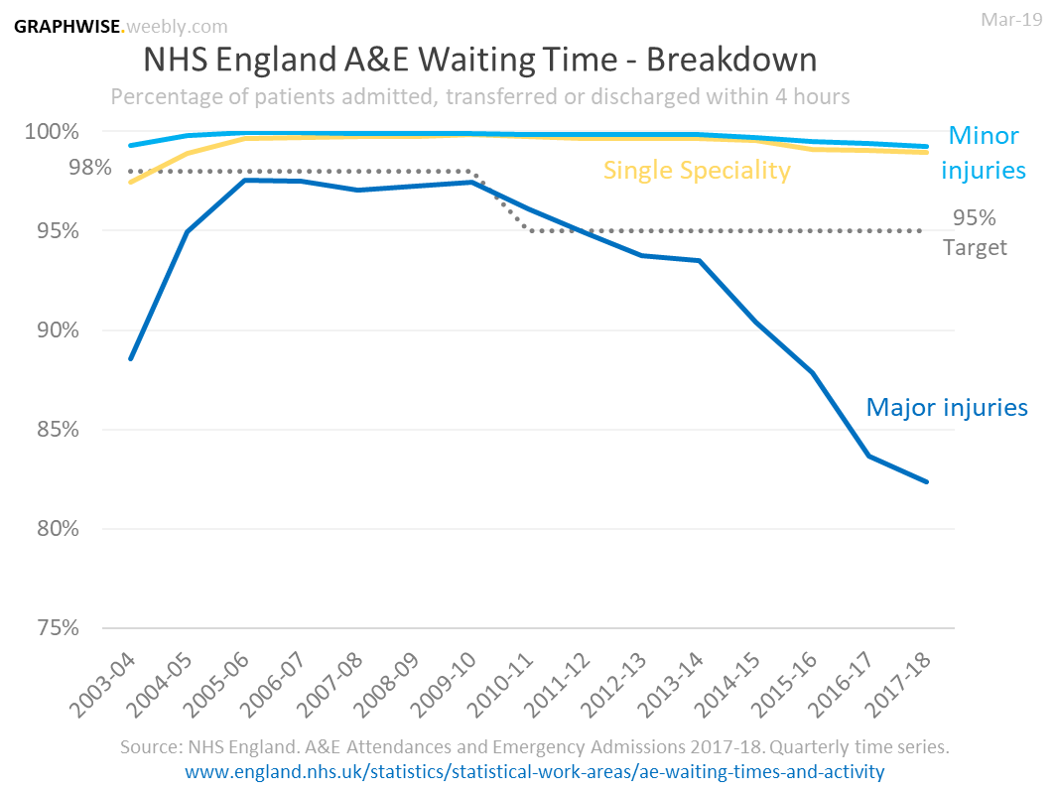
The breakdown shows that while the Minor injuries and Single Speciality attendees are largely being seen to within the 4 hour window, there is a significant number Major injuries attendees who are not being seen to within this set target.
The trend line shows the situation is getting worse, with more and more people with Major injuries having to wait longer than 4 hours to be seen to. The 95% target has not been achieved for the Major injuries category since 2011-12, with no sign of this improving. |
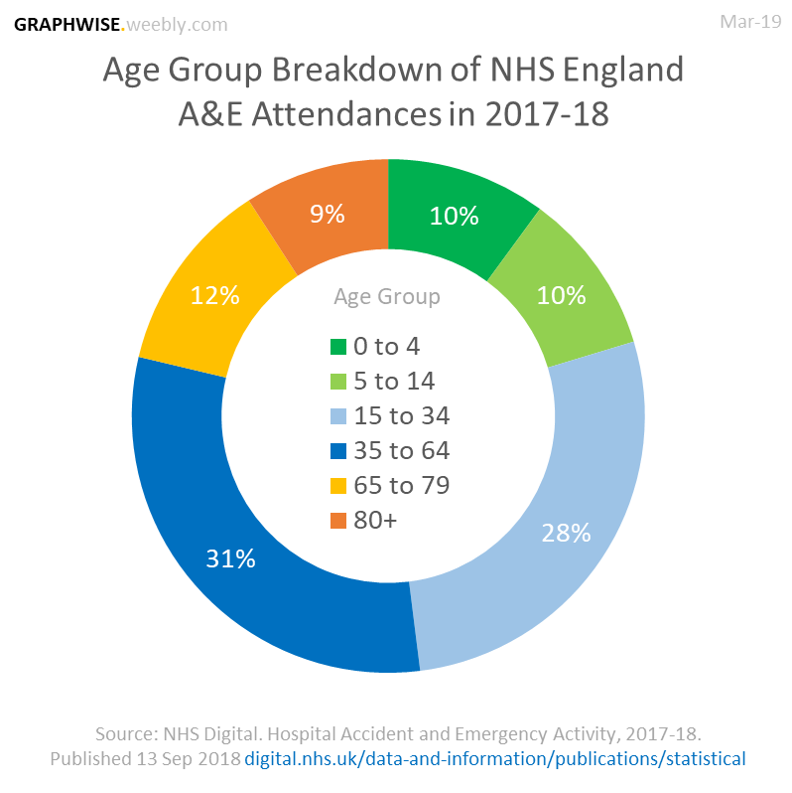
Age Group Breakdown
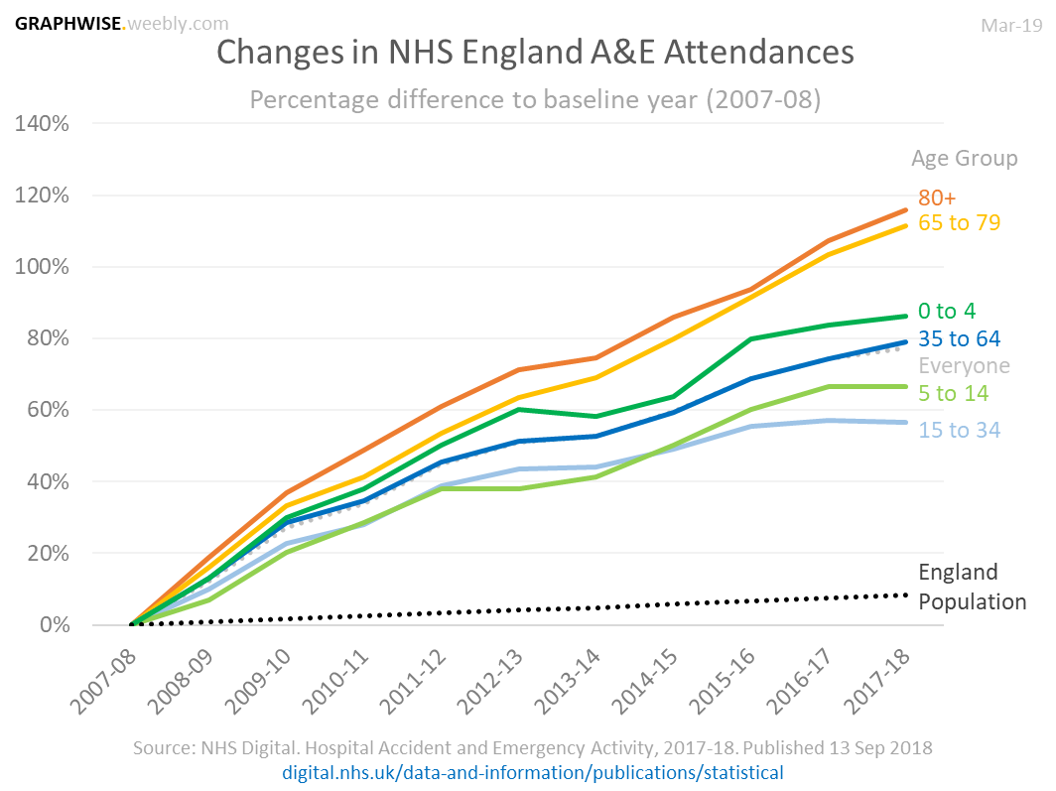
By age, the highest rate of increase is within the 65-79 and 80+ age groups, where there were 110-115% more attendances in 2017-18 compared with 10 years ago.
The overall number of attendances have increased by 77% in the last 10 years, which is significantly above the population increase of 8%. This is an indicator of the increasing pressures the A&E services are under. |
|