|
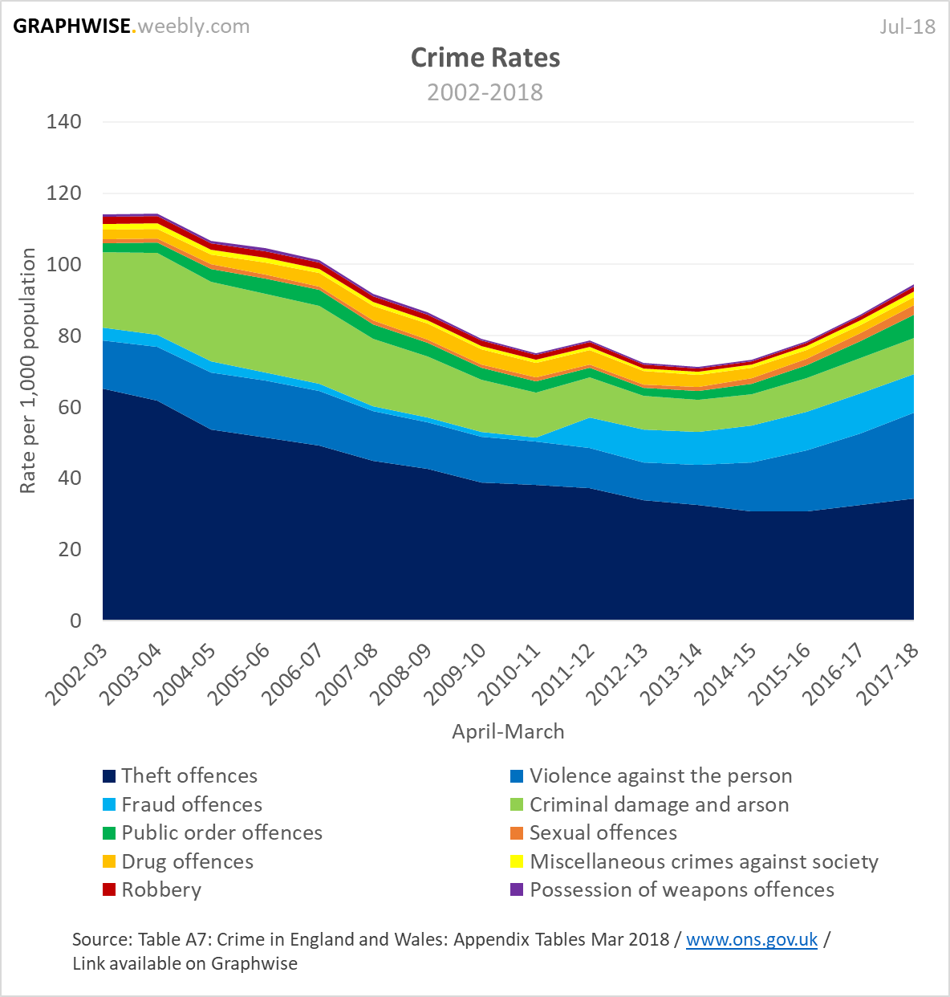
Q. What is the trend in UK crime? Which crimes make up the majority?
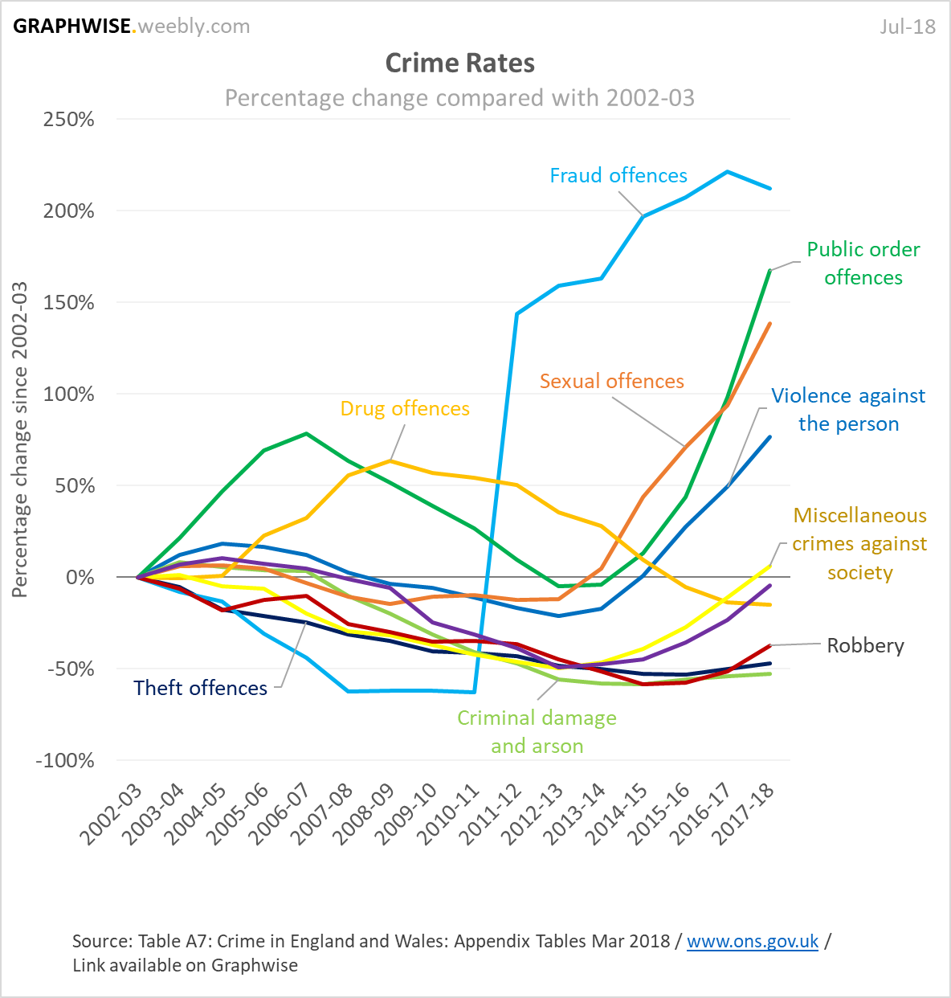
Q. Which crimes have increased/decreased the most? Q. How many acid attacks have there been in London? Q. Which London boroughs have the highest number of acid attacks? Q. What is the trend in the number of homicides? Which areas have the highest and lowest rates? |
SOURCES
Crime in England and Wales: Appendix Tables Release date: 19 July 2018. Next release: 18 October 2018 https://www.ons.gov.uk/peoplepopulationandcommunity/crimeandjustice/datasets/crimeinenglandandwalesappendixtables appendixtablesyearendingmarch2018.xls FOI request. Metropolitan Police Service, 20/01/2018 Corrosive Fluid Attack Offence Figures 2012-2017 https://www.whatdotheyknow.com/request/acid_attacks_14 |
Crime Rates
|
|
According to the Office of National Statistics (ONS), from 2002 the overall Crime Rate was falling for more than 10 years, but since 2013, it has been increasing again. The biggest drivers of this change in trend are Violent Crimes and Fraud Offences, which have both seen significant increases. |
London Acid Attacks
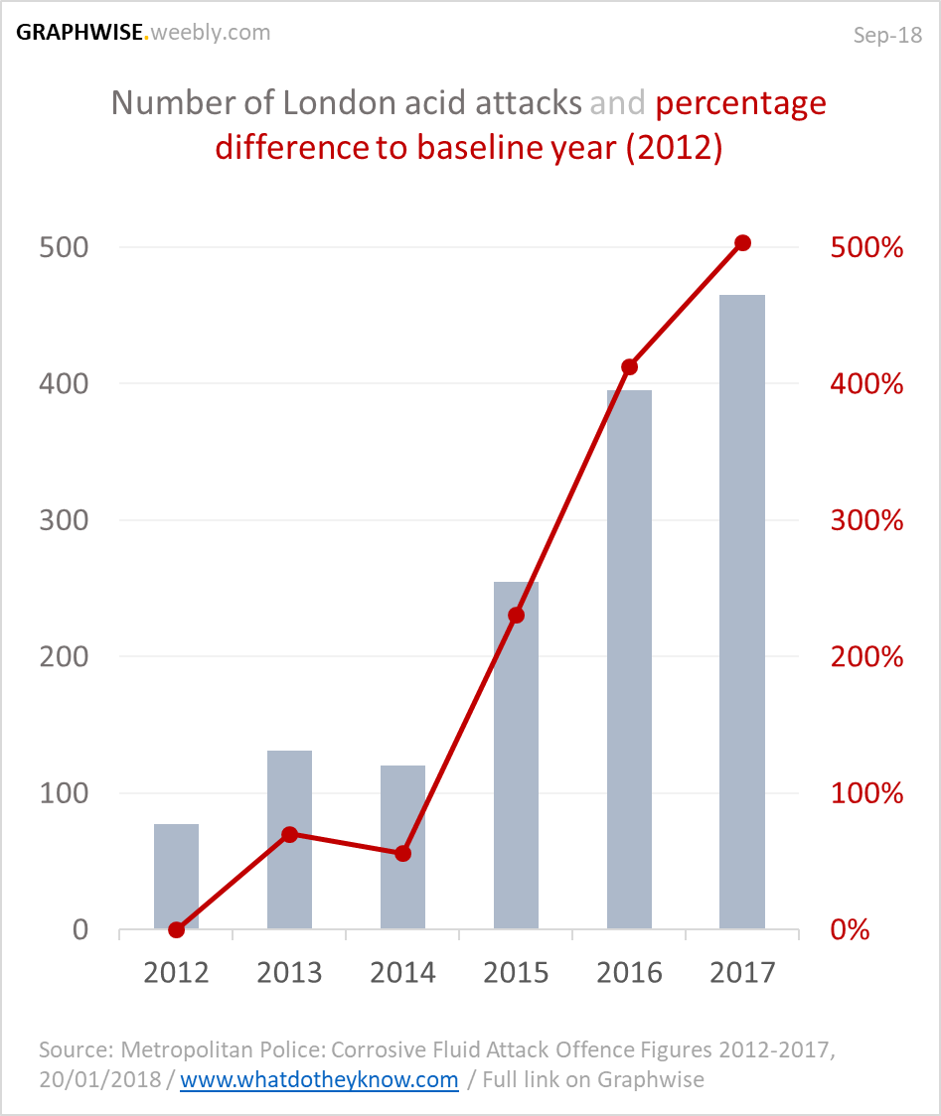
Compared with 2012, the number of acid attacks in London has increased by 500%. |
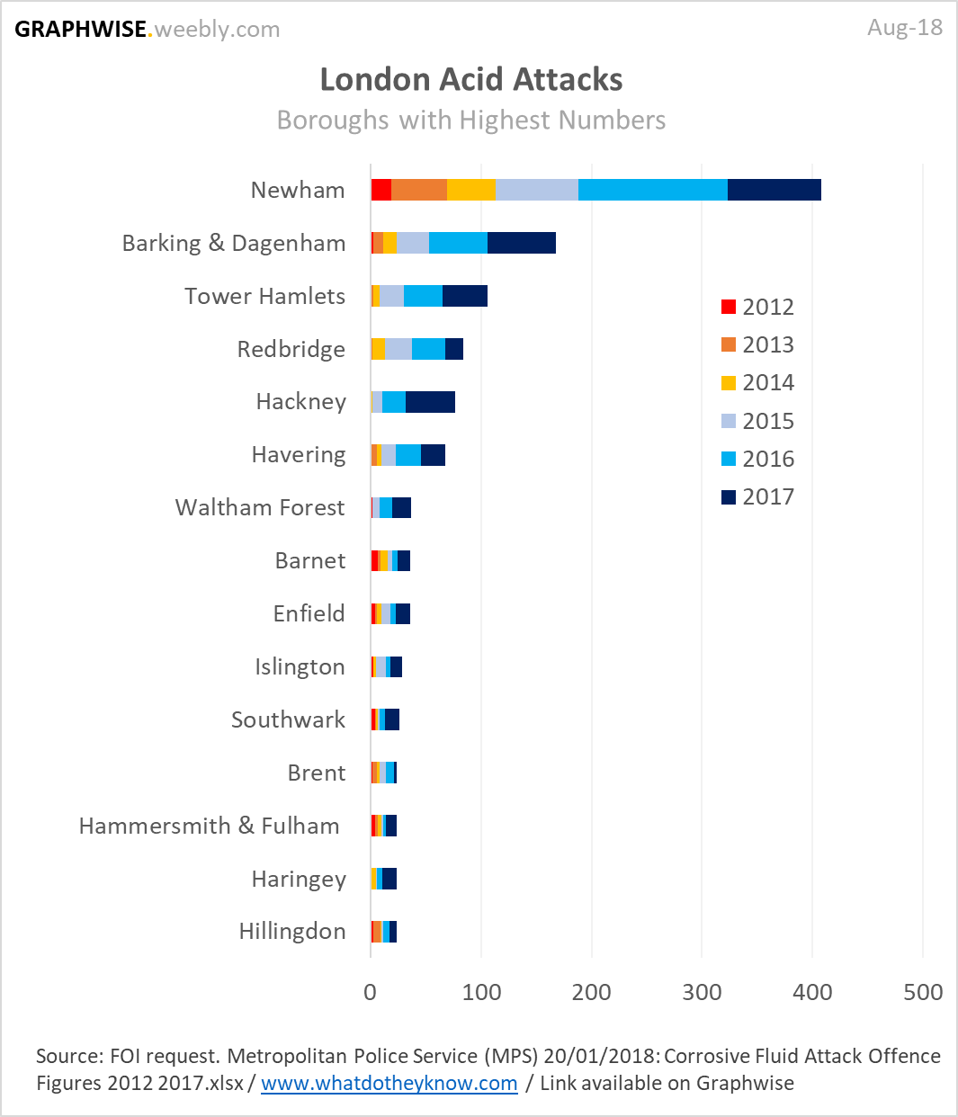
The borough with the highest number of acid attacks is Newham, then Barking & Dagenham and Tower Hamlet. |
Number of London Acid Attacks
2012
2013
2014
2015
2016
2017
|
Homicides
|
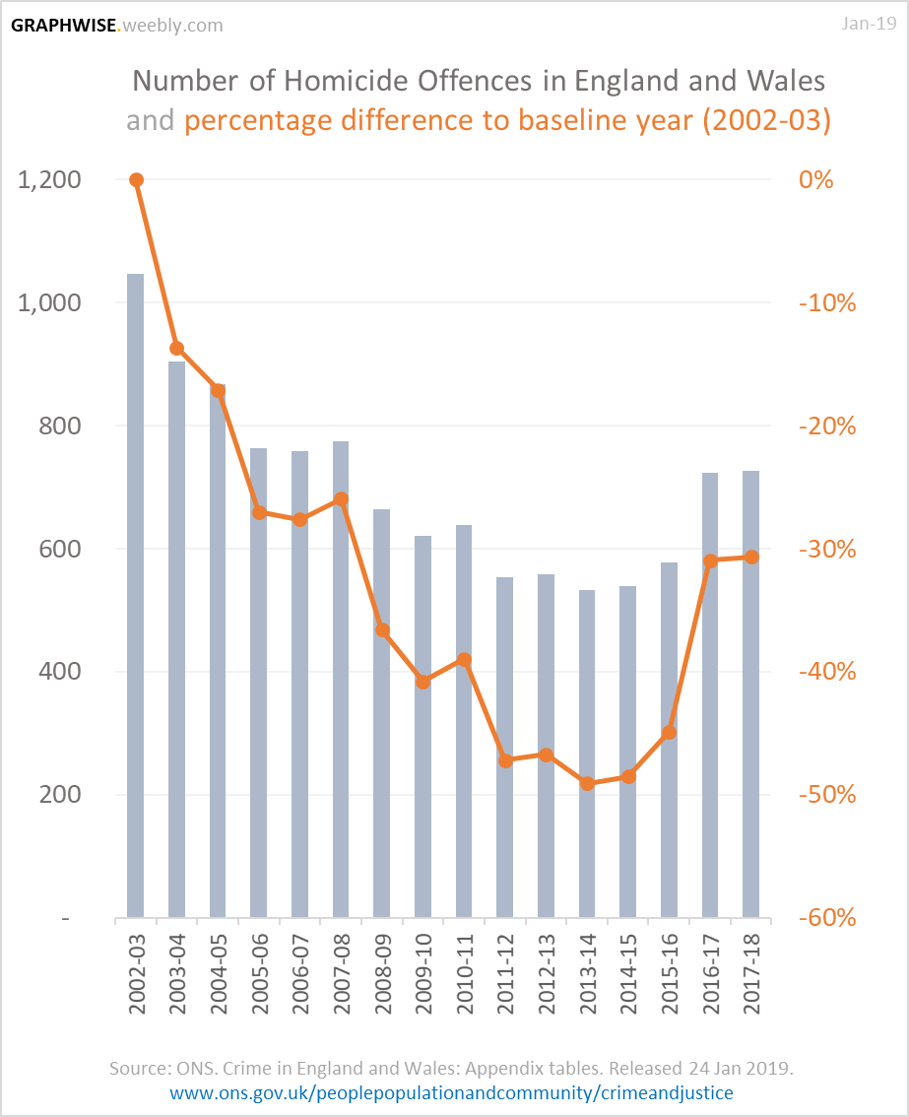
The number of homicide offences in England and Wales steadily decreased between 2002-03 and 2013-14, but has since been increasing to an overall -30% difference. Significant events April 2016 – 1989 Hillsborough Disaster Ruling - 96 deaths reclassified to homicide May 2017 - Manchester Arena Bombing - 22 people killed + the attacker March 2017 – Westminster Bridge Attack - 5 people killed + the attacker June 2017 – London Bridge Attack - 8 people killed + the 3 attackers |
Homicide Offences in England & Wales
2002-03
2005-06
2009-10
2013-14
2017-18
|
|
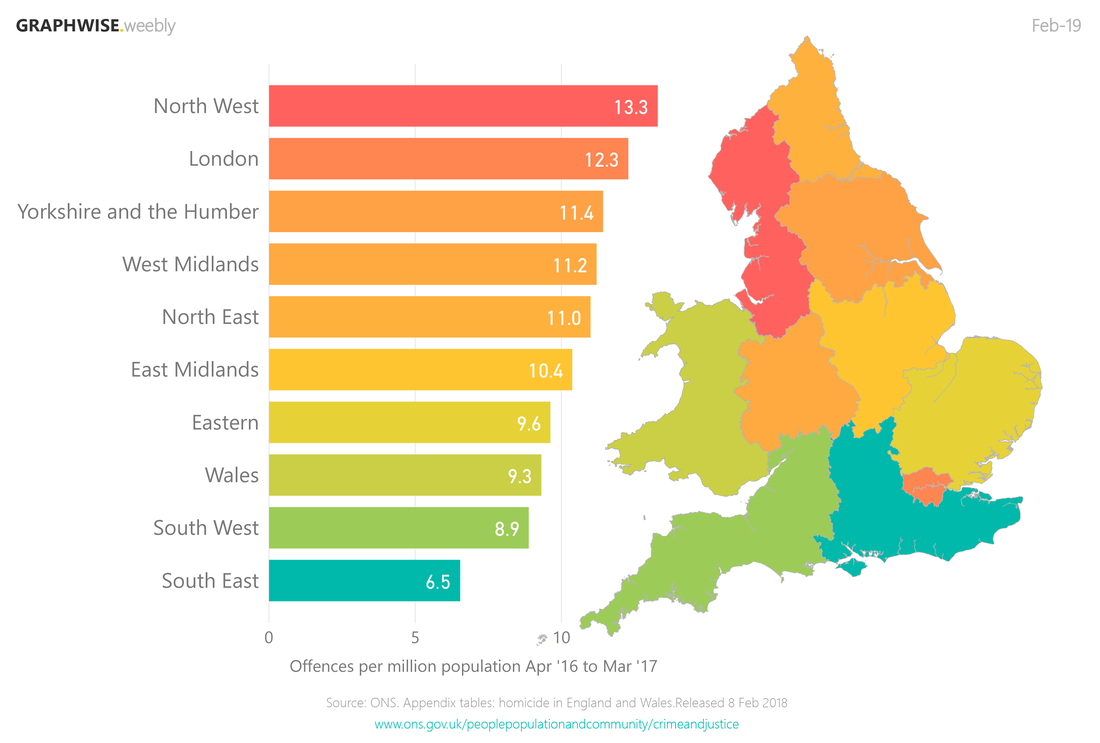
In 2016-17, the highest rates of homicides were in the North West, London, and Yorkshire & the Humber. Whereas, the lowest rates were in the South East, South West, and Wales. This is excluding the 96 deaths from the 1989 Hillsborough Disaster that would otherwise skew the results to show Yorkshire & the Humber as 29.1 homicide offences per million people. |
