|
Q. How many NHS Beds are occupied on average?
Q How many are there available? Q. What are the trends in Bed Occupancy? Q. What is the breakdown by Ward? Q. Is there a growing issue around Bed Spaces in the NHS? |
SOURCES
NHS England. Bed Availability and Occupancy Data – Overnight. Updated Nov 2018. https://www.england.nhs.uk/statistics/statistical-work-areas/bed-availability-and-occupancy/bed-data-overnight/ Time-series Beds Time-series 2010-11 onwards (Adjusted for missing data) (XLS, 87KB) 2018-19 NHS organisations in England, Quarter 2, 2018-19 (XLS, 135KB) NHS organisations in England, Quarter 1, 2018-19 (XLS, 145KB) 2017-18 NHS organisations in England, Quarter 4, 2017-18 (XLS, 143KB) NHS organisations in England, Quarter 3, 2017-18 (revised 24.05.2018) (XLS, 145KB) NHS organisations in England, Quarter 2, 2017-18 (revised 24.05.2018) (XLS, 146KB) NHS organisations in England, Quarter 1, 2017-18 (revised 24.05.2018) (XLS, 147KB) 2016-17 NHS organisations in England, Quarter 4, 2016-17 (revised 23.11.2017) (XLS, 145KB) NHS organisations in England, Quarter 3, 2016-17 (revised 23.11.2017) (XLS, 148KB) NHS organisations in England, Quarter 2, 2016-17 (revised 23.11.2017) (XLS, 148KB) NHS organisations in England, Quarter 1, 2016-17 (revised 23.11.2017) (XLS, 149KB) 2015-16 NHS organisations in England, Quarter 4, 2015-16 (revised 18.08.2016) (XLS, 149K) NHS organisations in England, Quarter 3, 2015-16 (revised 23.02.2017) (XLS, 148K) |
Bed Occupancy Breakdown
|
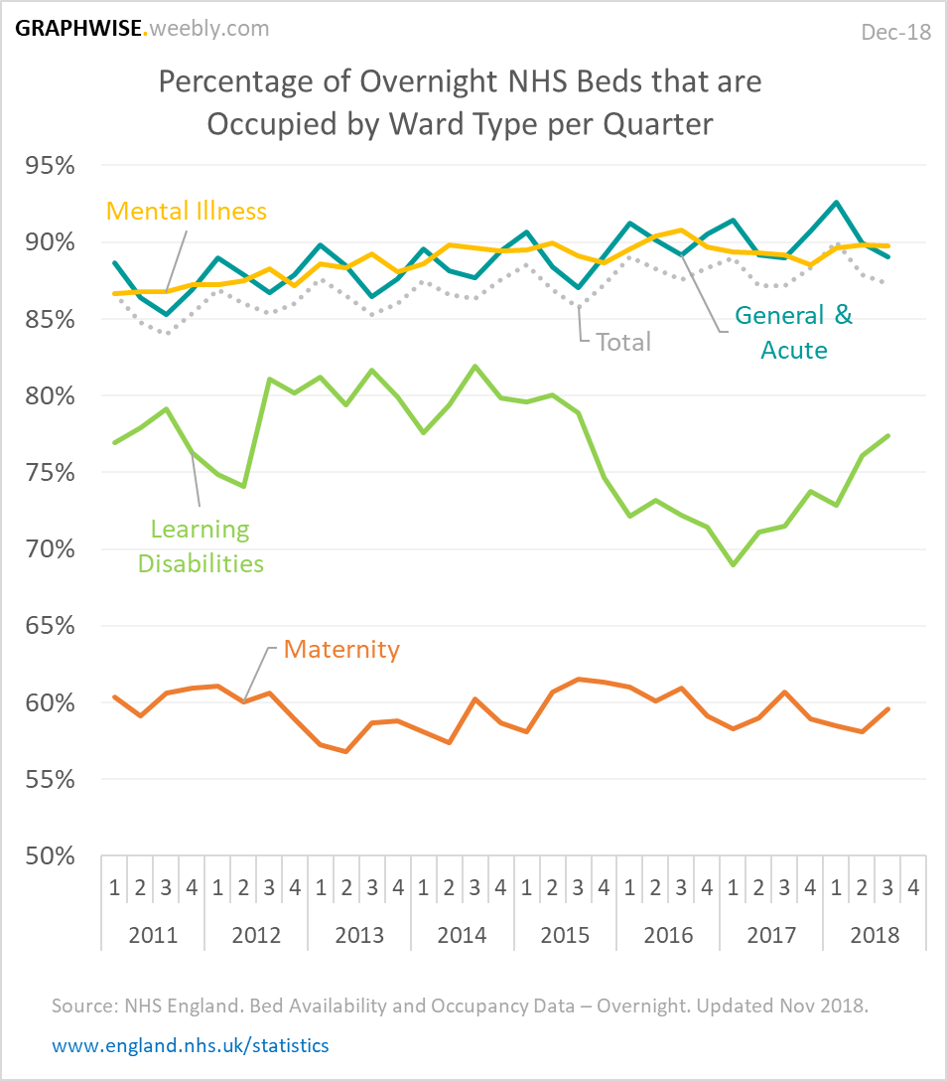
The overall occupancy of NHS Beds is gradually increasing to around 90%. General & Acute and Mental Illness Wards have the highest bed occupancy and are driving the overall trend. |
The trends in the Learning Disabilities Wards was decreasing between 2014 and 2016 but has since been increasing. The Bed Availability in the Maternity Wards is overall the least at risk, hovering around 60% occupancy. |
Total NHS Beds in Use by Ward Type
|
|
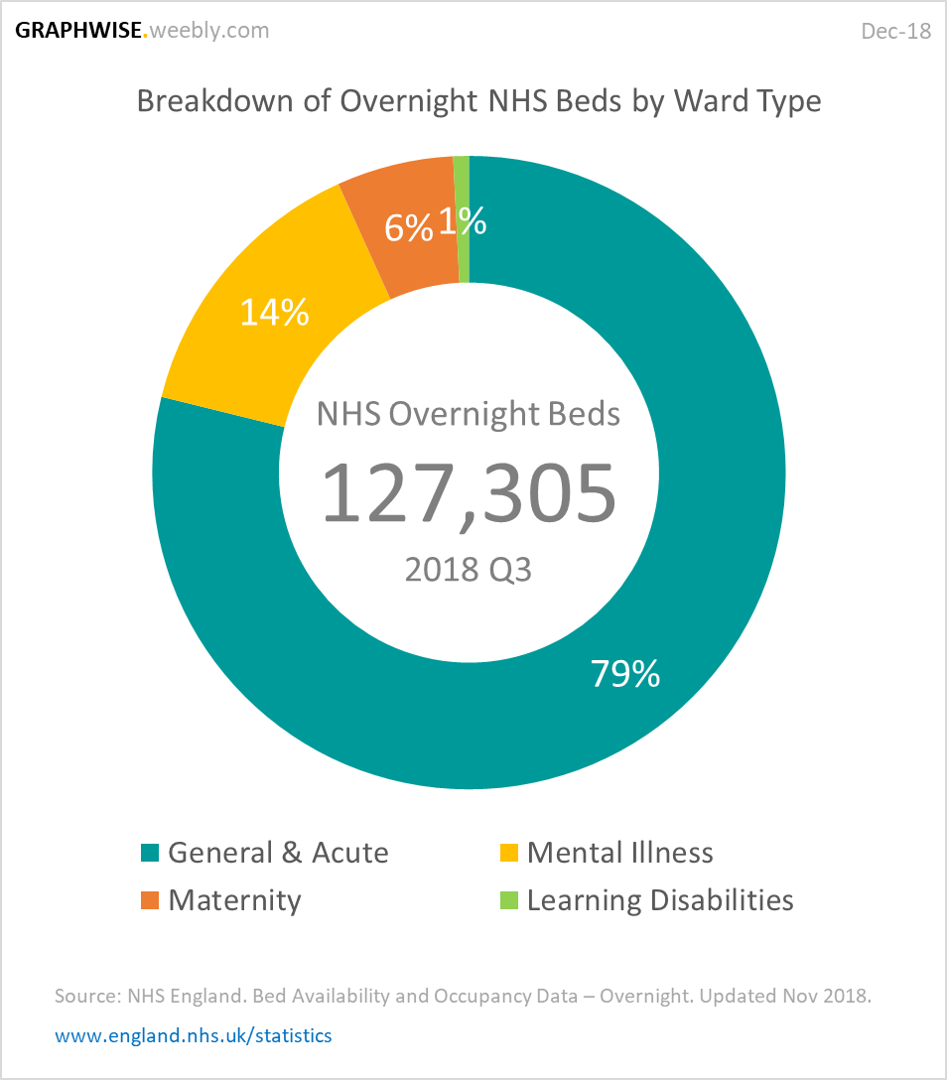
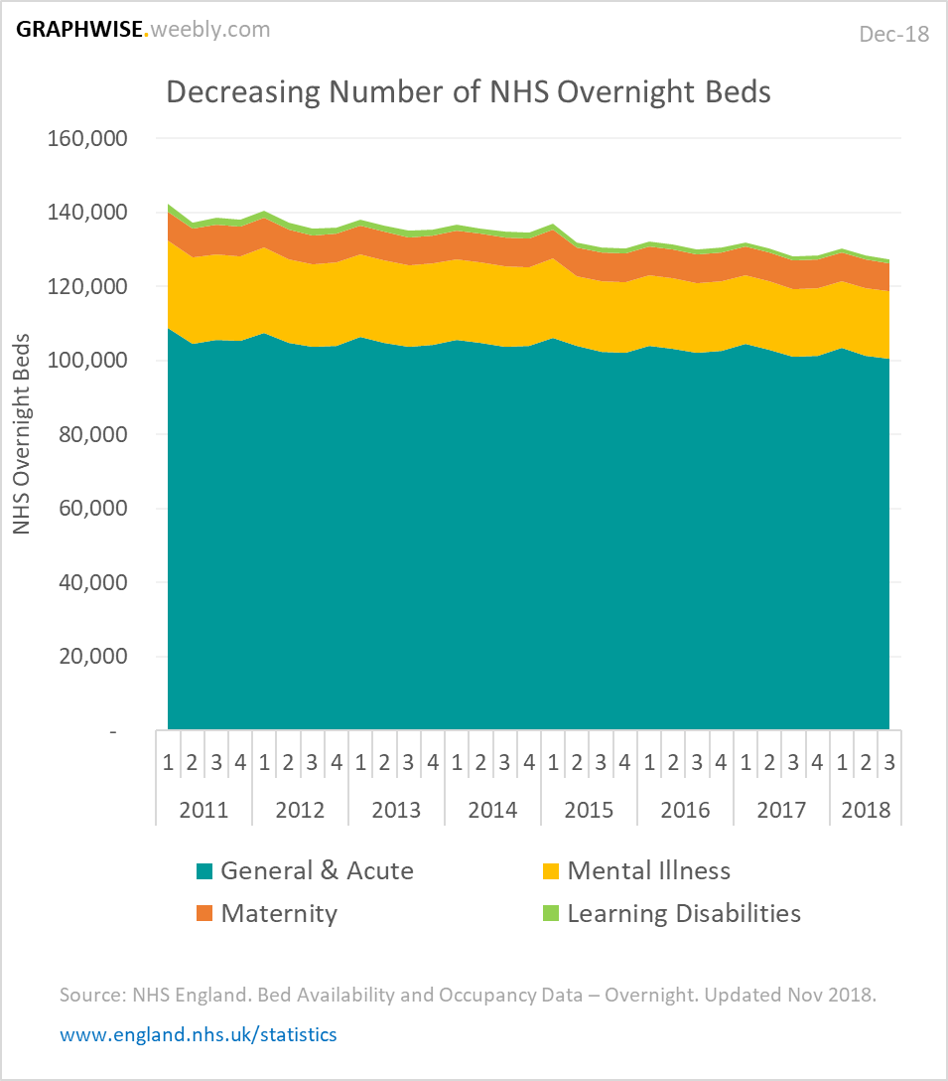
General & Acute beds represent the vast majority of hospital beds (79%). Then Mental Illness with 14%. Maternity is only 6% and Learning Disabilities is marginal with only 1% of the total. Overall, there has been a gradual reduction in the number of Overnight NHS Beds between 2011 and 2018. |
Bed Occupancy across the NHS
|
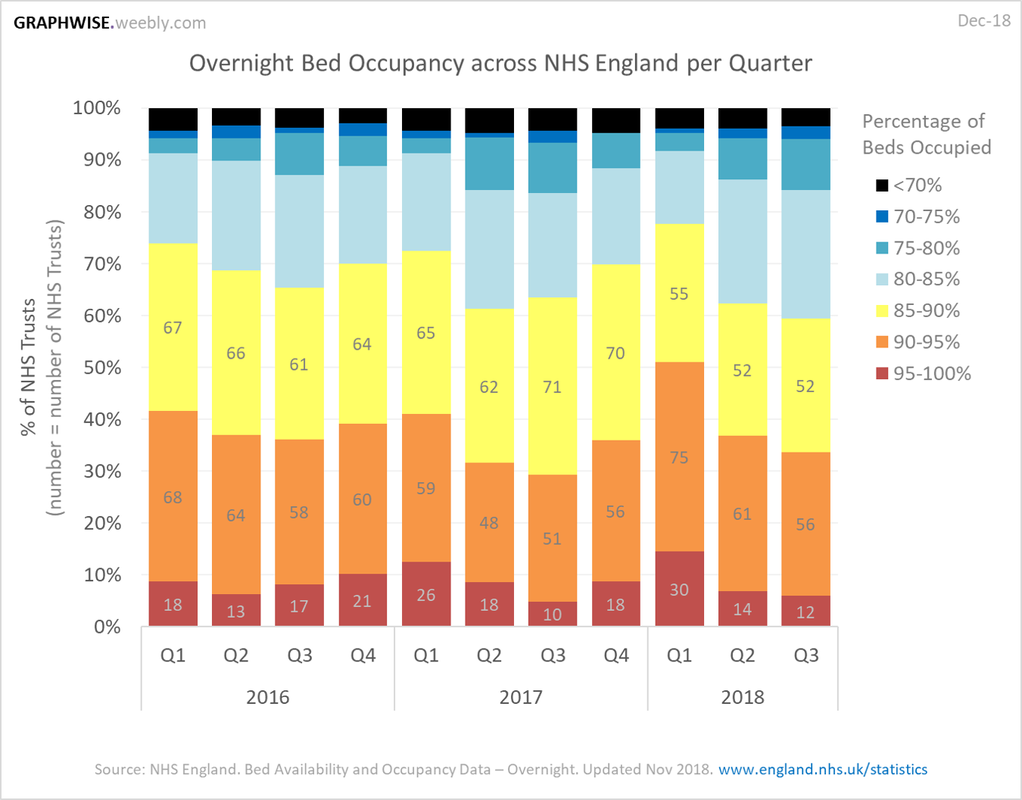
There is a growing number of hospitals with high or very high bed occupancy rates, where Quarter 1 seems to be the worst period for bed availability (January – March). Comparing Quarter 1's of each year – NHS Trusts with less than 5% of their overnight beds available: 2016 = 18 NHS Trusts 2017 = 26 NHS Trusts (+44%) 2018 = 30 NHS Trusts (+15%) |