|
Q. How have emissions changed in the last few decades?
Q. Are the EU targets being met? Q. Which cities have the worst / best air quality? Q. What are the main contributors to the NOx (Nitrogen Oxide) emissions? Q. How much do diesel vehicles make up of the NOx emissions? |
SOURCES
Air Quality Metrics DAQI regional data. The overall air pollution index for a site or region is determined by the highest concentration of five pollutants. https://uk-air.defra.gov.uk/data/DAQI-regional-data National air quality objectives https://uk-air.defra.gov.uk/air-pollution/uk-eu-limits |
Emissions
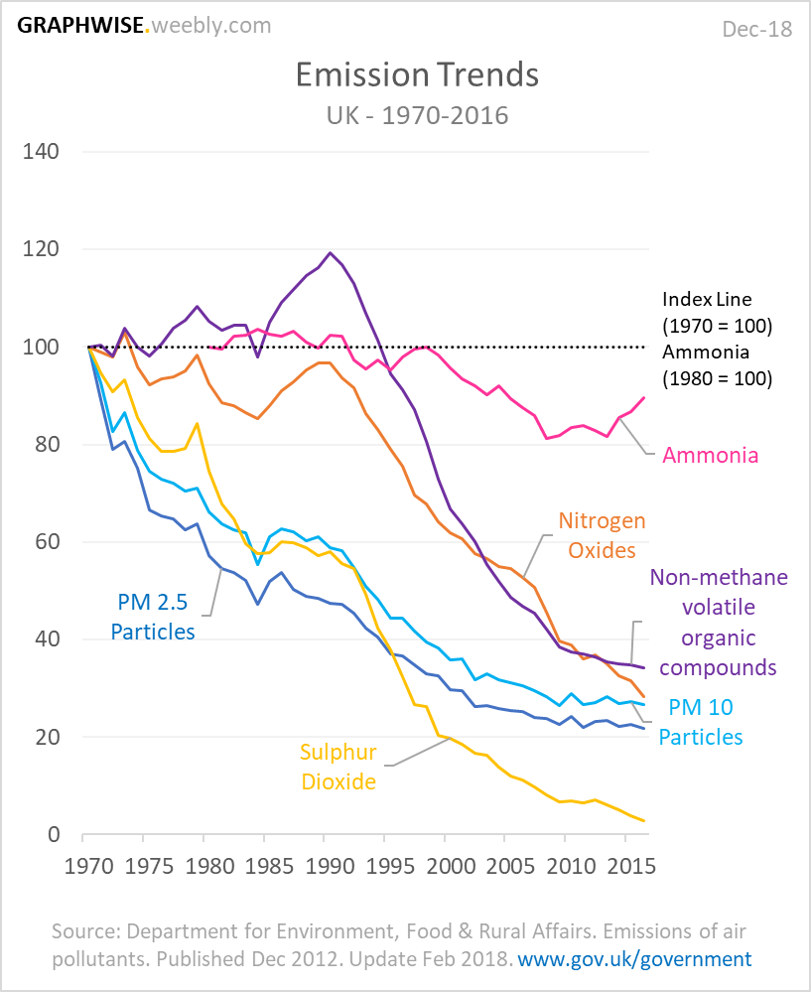
Most of the air pollution emissions have significantly dropped since 1970, apart from Ammonia, which has decreased slightly since 1980 but has recently started to increase. |
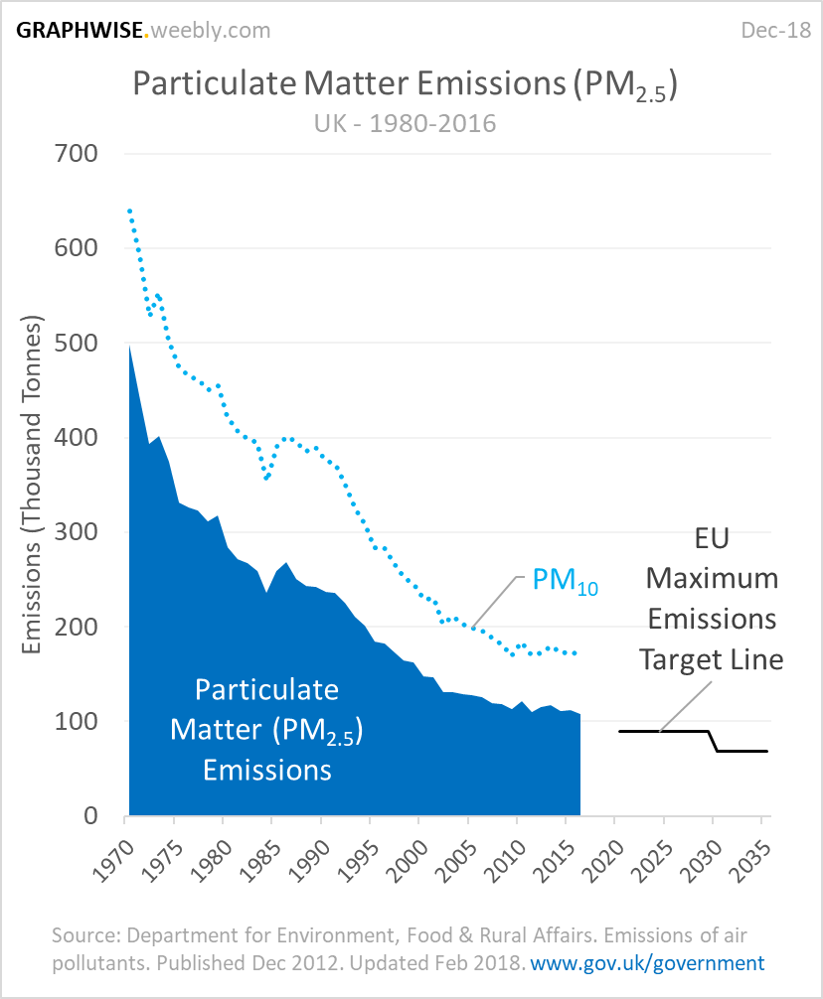
There has been a significant drop in Particulate Matter emissions, both the smaller PM2.5 and larger PM10 size. However, the trend line looks like it will likely miss the EU 2020 target by a small margin. |
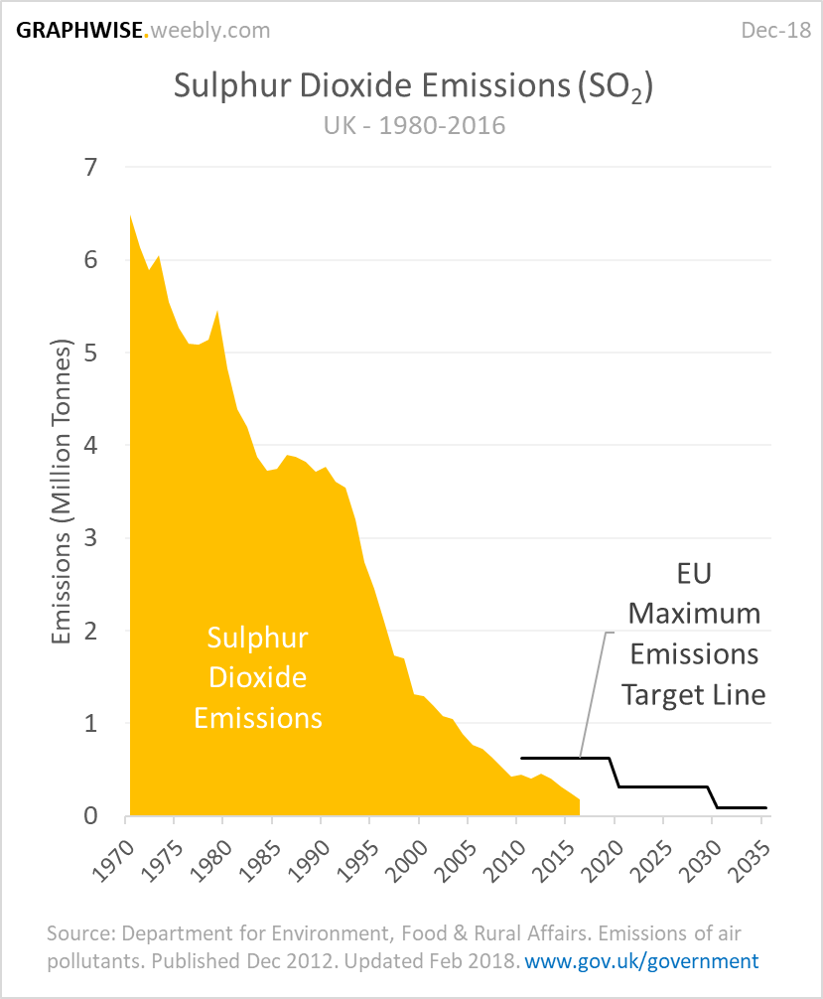
There has been a significant drop in Sulphur Dioxide emissions, achieving the 2010 EU target. The targets for 2020 and 2030 also look likely to be achieved. |
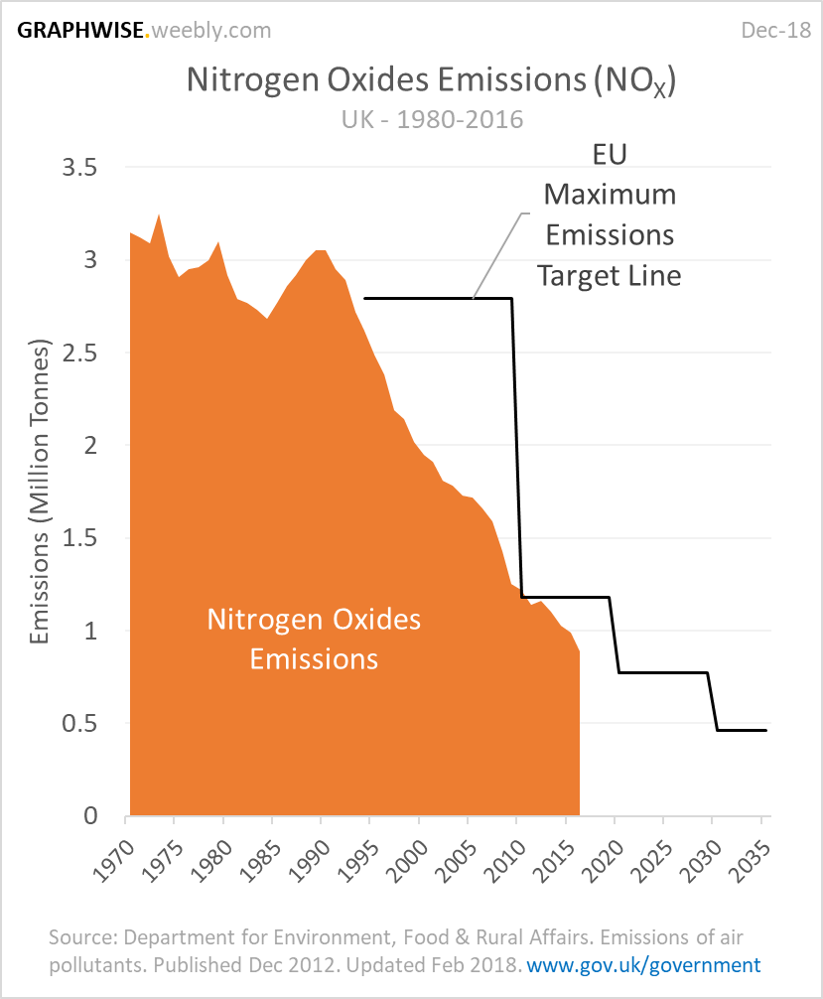
There has been a significant drop in Nitrogen Oxides emissions, with the EU targets achieved, or set to be achieved. |
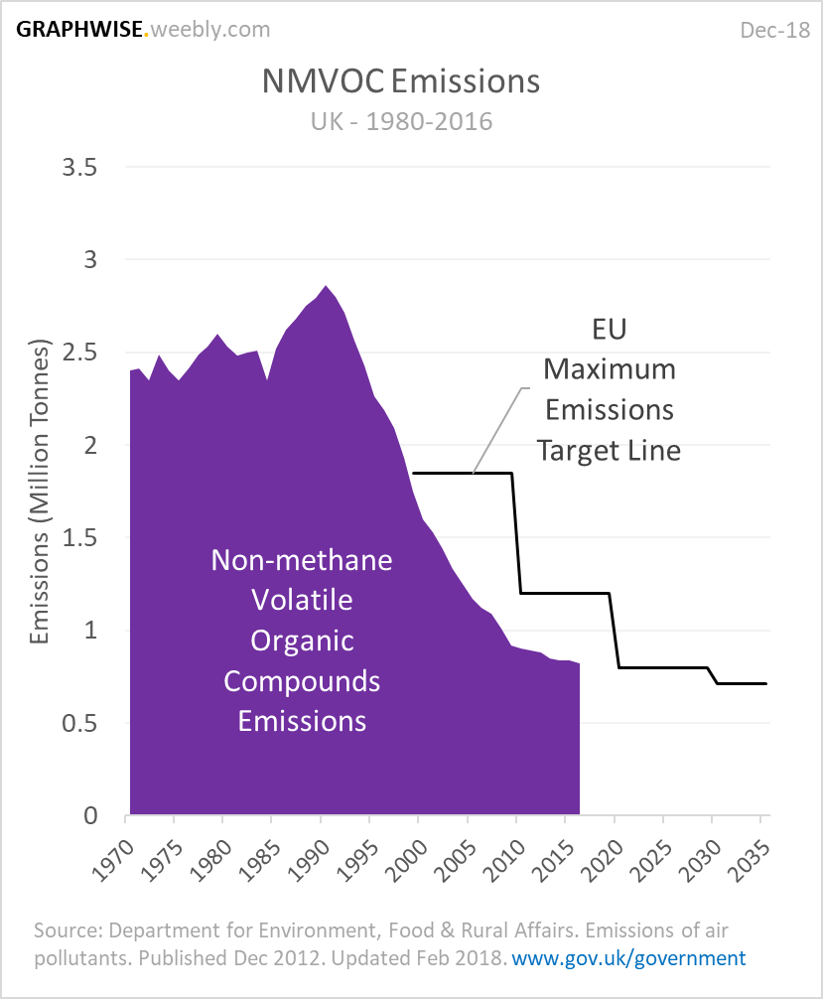
There has been a significant drop in non-methane volatile organic compound emissions, achieving the 2000 and 2010 EU targets and likely to achieve the 2020 and 2030 targets. |
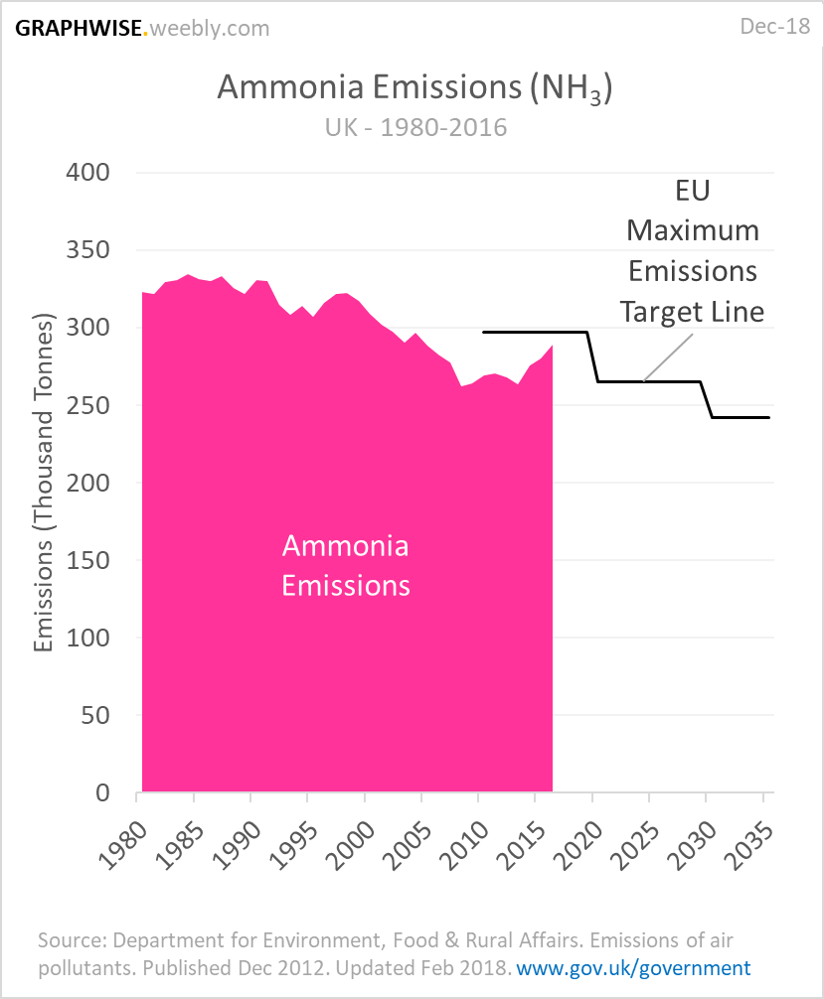
There has been an overall reduction in Ammonia emissions since 1980 however, there is an increasing trend since 2009/2010, which is likely to lead to the UK surpassing the maximum emissions target line and suggests the EU 2020 target will be missed. |
City Air Quality
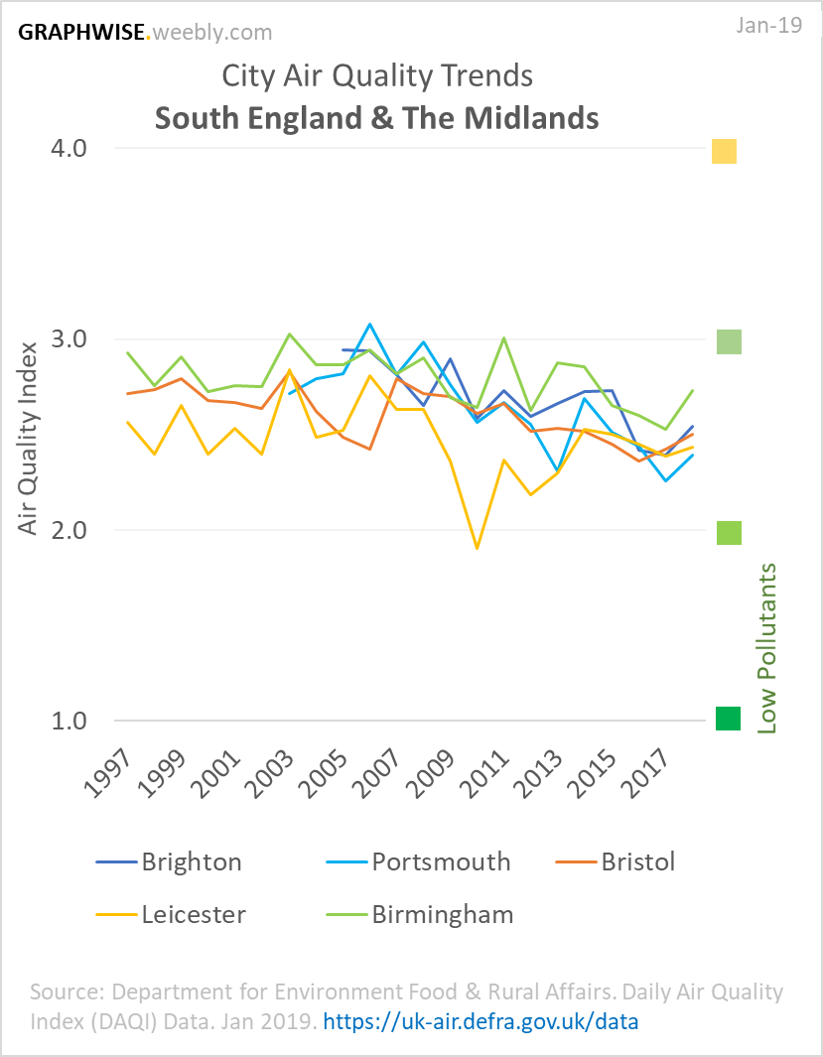
Cities in the South and the Midlands all show a similar decreasing trend towards better Air Quality and have similar levels of emissions. |
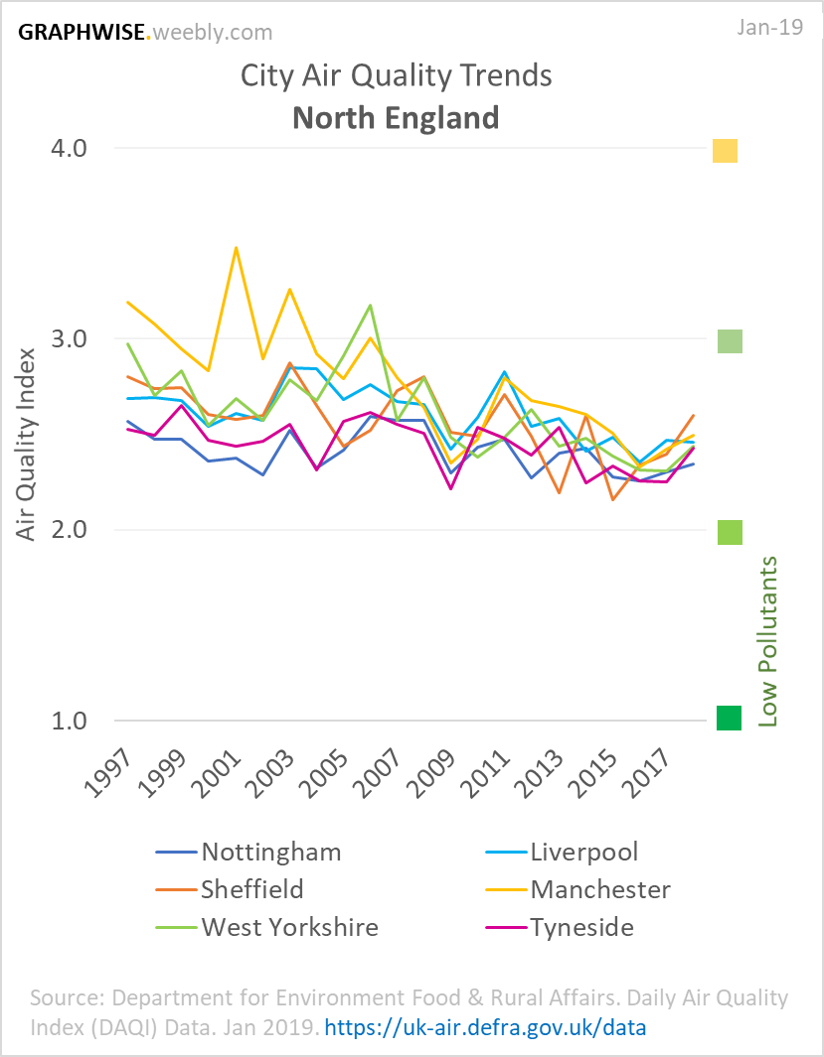
Cities in the North all show a similar decreasing trend towards better Air Quality and have similar levels of emissions. Manchester had the worst Air Quality in the 90's but has since improved to be the same as the others. |
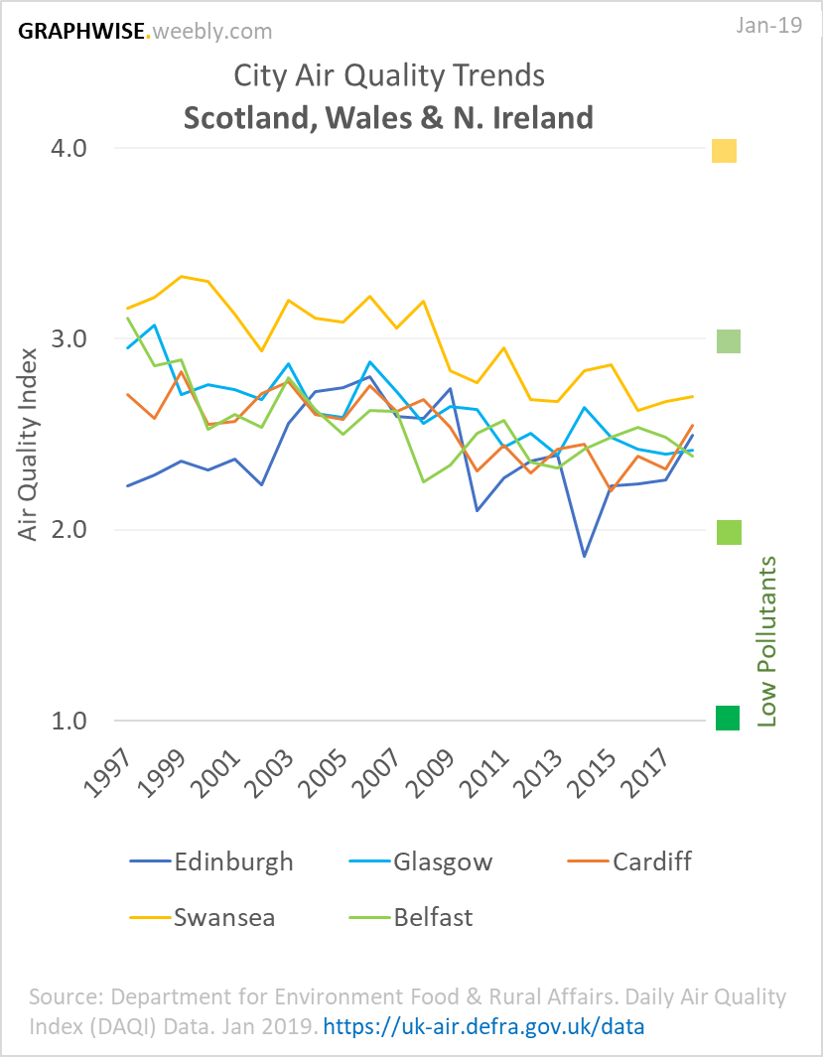
Cities in Scotland, Wales and Northern Ireland all show a similar decreasing trend towards better Air Quality and have similar levels of emissions. Compared with other cities, Swansea has the worst Air Quality but is improving. |
Roadside NOx Emissions
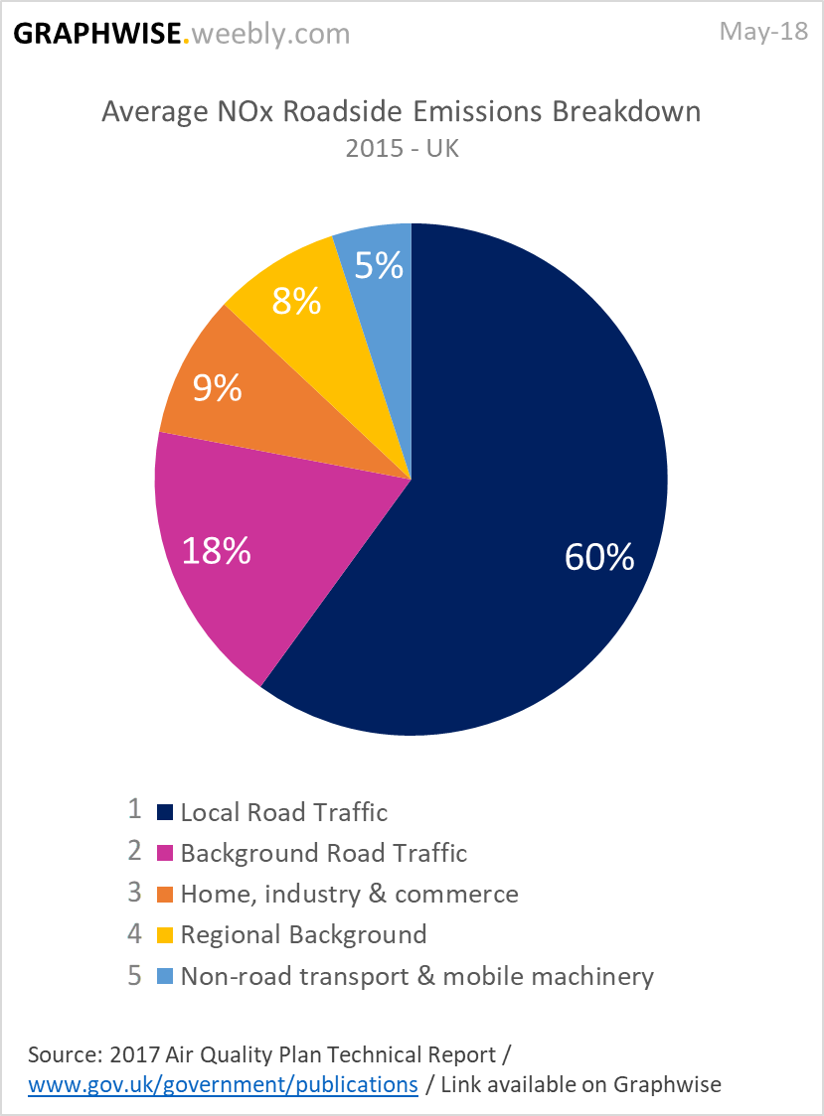
Nitrogen Oxide (NOx) emissions near UK roads are mostly caused by the traffic (78%), with 9% coming from Home, Industry and commerce, 8% from regional background, and 5% from non-road transport and mobile machinery. |
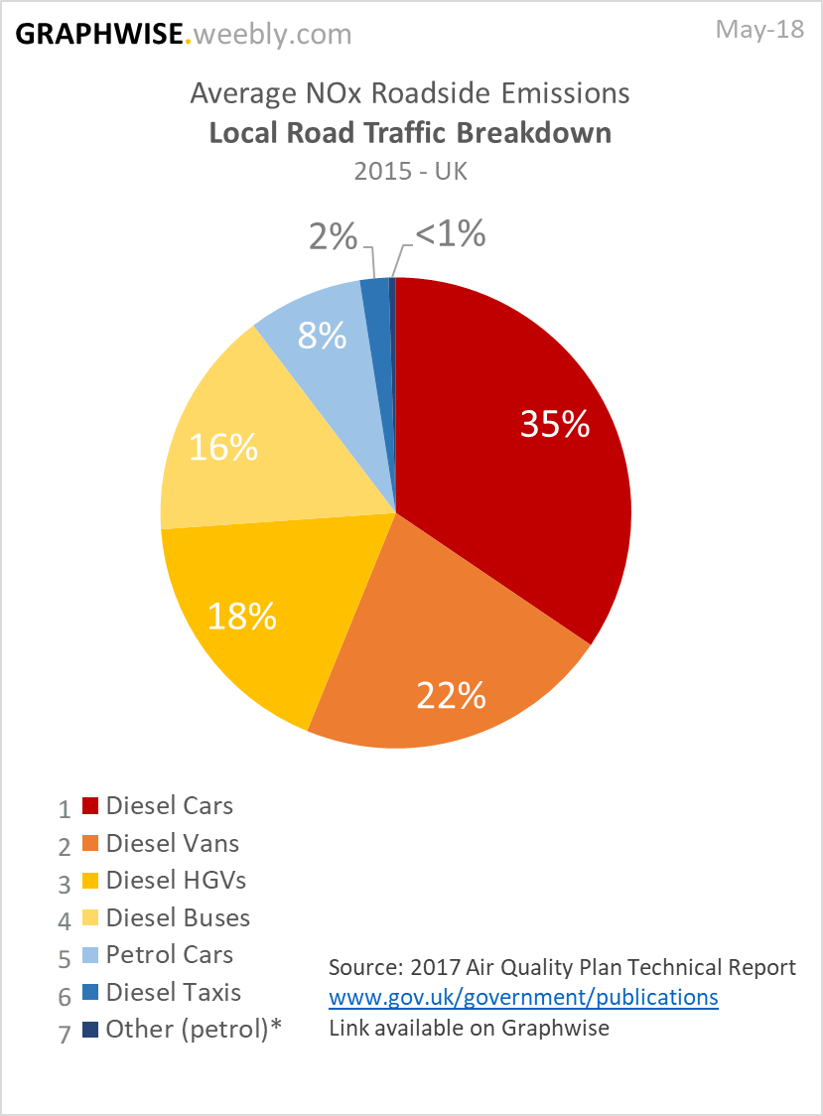
The vast majority of Local Road Traffic NOx emissions comes from Diesel vehicles (90%). |