|
Q. How many people are claiming benefits? How has this changed?
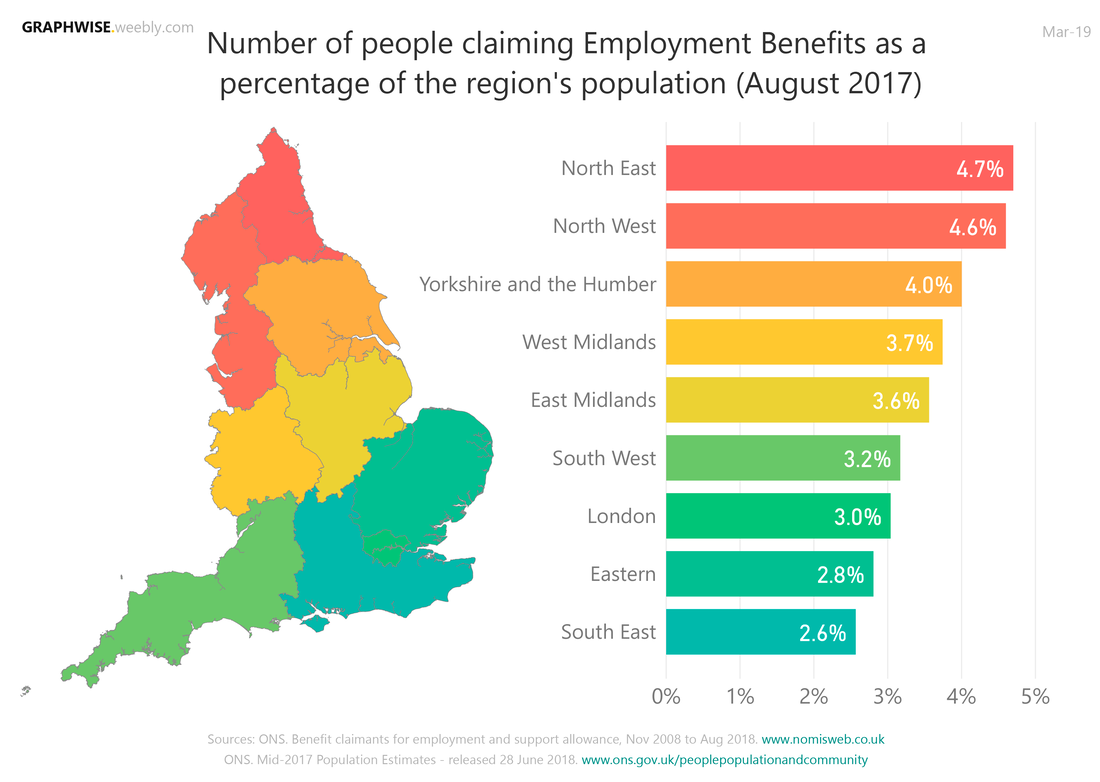
Q. How does this breakdown by region? |
Sources
ONS – NOMI database. Benefit claimants for employment and support allowance (Nov 2008 to Aug 2018). http://www.nomisweb.co.uk/query/select/getdatasetbytheme.asp?opt=3&theme=&subgrp |
Long term trends
|
|
Since 2008, there has been a significant increase in the overall number of people claiming benefits, which has been steadily declining since the peak in 2015-2016.
Around 2011, the number of Claimants increased from approximately 525,000 to 2,250,000 in 3 years. The vast majority are based in England, where the numbers seem to be fairly evenly spread across the country. By region, the highest numbers are in the North West, London and the South East.
|
|
|
As a percentage difference to the baseline month and year (November 2008), England, Scotland and Wales all show the same overall trend, as well as the English regional breakdown.
There was a 1,000% increase between 2008 and 2011, where the numbers were starting to level out. But then it suddenly started to increase significantly up to an overall 4,000% more than the baseline.
|
Regional Breakdown
|
However, if we 'normalise' the data by the regional population i.e. work out the number of people claiming benefits as a percentage of the people in that given area, we can see a very clear trend.
The lowest rates are seen in the South and increase as you move further up the map, with the highest rates of benefit claimants in the North. This is an indicator of where people are struggling more economically.
|